The "Average Page" is a myth
 As anyone and everyone in the web performance community will tell you, the size of the average page is continuously getting bigger: more JavaScript, more image and video bytes, growing use of web fonts, and so on. In fact, as of December 2015, the HTTP Archive shows that the average desktop site weighs in at 2227KB, and mobile is up to 1253KB.
Except, what is an "average page", exactly? Intuitively, it is a page that is representative of the web at large, in its payload size, distribution of bytes between different content types, etc. More technically, it is a measure of central tendency of the underlying distribution - e.g. for a normal distribution the average is the central peak, with 50% values greater and 50% values smaller than its value. Which, of course, begs the question: what is the shape and type of the distribution for transferred bytes and does it match this model? Let's plot the histogram and the CDF plots...
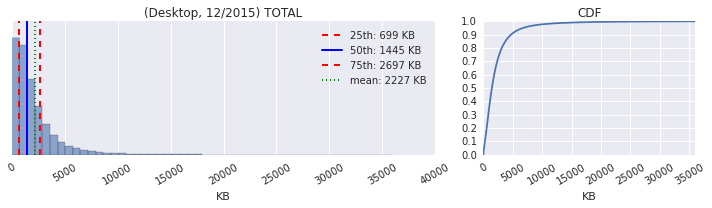
- The x-axis shows that we have outliers weighing in at 30MB+.
- The quantile values are 25th: 699KB, 50th (median): 1445KB, 75th: 2697KB.
- The CDF plot shows that 90%+ of the pages are under 5000KB.
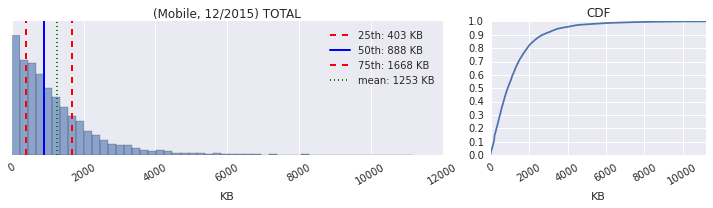
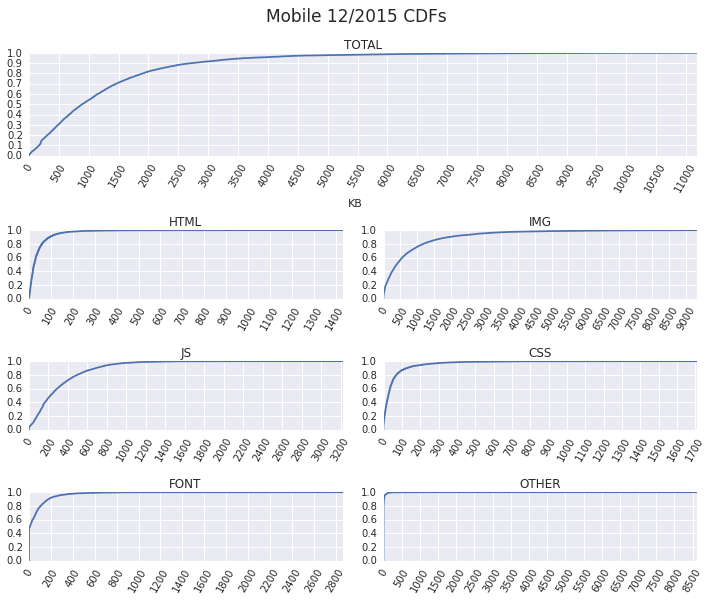
- The x-axis shows that we have outliers weighing in at 10MB+.
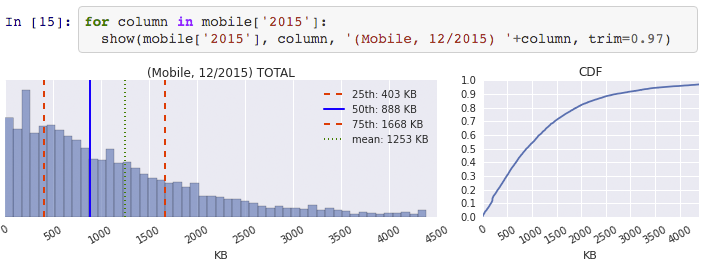
- The quantile values are 25th: 403KB, 50th (median): 888KB, 75th: 1668KB.
- The CDF plot shows that 90%+ of the pages are under 3000KB.
Let's start with the obvious: the transfer size is not normally distributed, and there is no meaningful "central value" and talking about the mean is meaningless, if not deceiving - see "Bill Gates walks into a bar...". We need a much richer and nuanced language and statistics to capture what's going on here, and an even richer set of tools and methods to analyze how these values change over time. The "average page" is a myth.
I've been as guilty as anyone in (ab)using averages when talking about this data: they're easy to get and simple to communicate. Except, they're also meaningless in this context. My 2016 resolution is to kick this habit. Join me.
Page weight as of December 2015
Coming up with a small set of descriptive statistics for a dataset is hard, and attempting to reduce a dataset as rich as HTTP Archive down to a single one is an act of folly. Instead, we need to visualize the data and start asking questions.
For example, why are some pages so heavy? A cursory look shows that the heaviest ~3% by page weight, both for desktop (>7374KB) and mobile (>4048KB), are often due to large (and/or heavy) number of images. Emphasis on often, because a deeper look at the most popular content types shows outliers in each and every category. For example, plotting the CDFs for desktop pages yields:
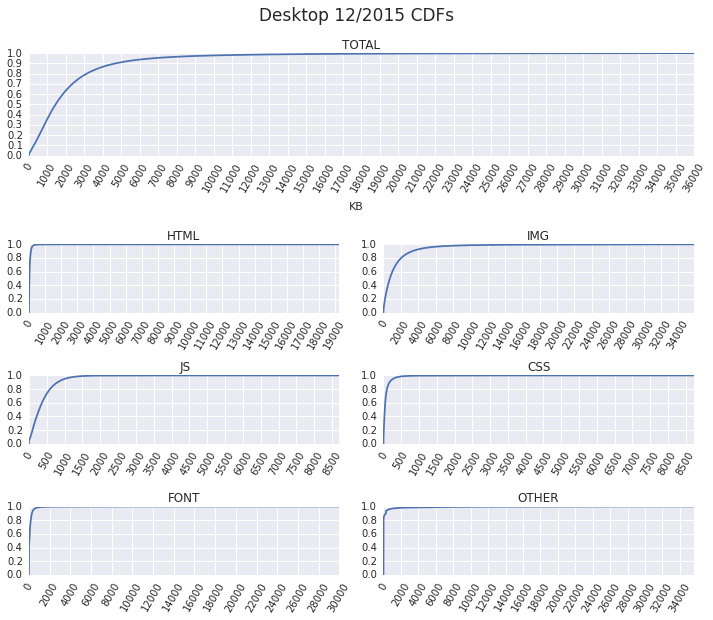
We have pages that fetch tens of megabytes of HTML, images, video, and fonts, as well as high single-digit megabytes of JavaScript and CSS. Each of these "obese" outliers is worth digging into, but we'll leave that for a separate investigation. Let's compare this data to the mobile dataset.
Lots of outliers as well, but the tails for mobile pages are not nearly as long. This alone explains much of the dramatic "average page" difference (desktop: 2227KB, mobile: 1253KB) — averages are easily skewed by a few large numbers. Focusing on the average leads us to believe that mobile pages are significantly "lighter", whereas in reality all we can say so far is that the desktop distribution has a longer tail with much heavier pages.
To get a better sense for the difference in distributions between the desktop and mobile pages, let's exclude the heaviest 3% that compress all of our graphs and zoom in on the [0, 97%] interval:
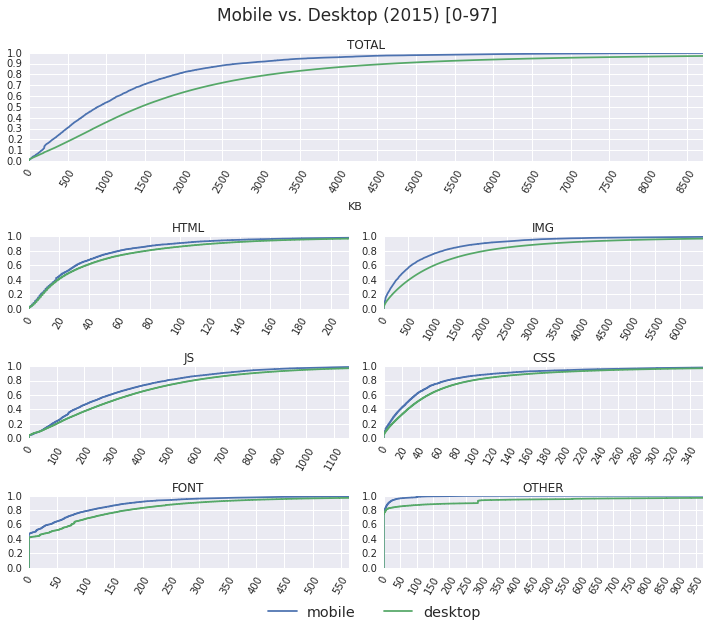
Mobile pages do appear to consume fewer bytes. For example, a 1000KB budget would allow the client to fetch fully ~38% of desktop pages vs. 54% of mobile pages. However, while the savings for mobile pages are present for all content types, the absolute differences for most of them are not drastic. Most of the total byte difference is explained by fewer image bytes. Structurally, mobile pages are not dramatically different from desktop pages.
Changes in page weight over time
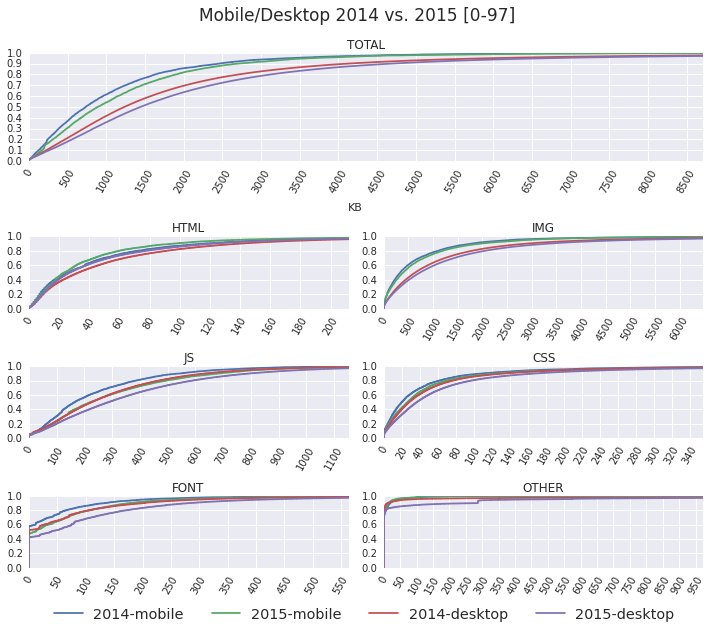
Comparing the CDFs against the year prior shows that the transfers sizes for most content types have increased for both the desktop and mobile pages. However, there are some unexpected and interesting results as well:
- The amount of shipped HTML bytes has decreased!
- 2015-mobile and 2014-desktop distributions tend to overlap.
In terms of bytes fetched, for everything but images, mobile pages are a year behind their desktop counterparts? Intuitively, this makes sense, just because we're working with a smaller screen doesn't mean the required functionality is less, or less complex.
Take the data out for a spin...
My goal here is to raise questions, not to provide answers; this is a very shallow analysis of a very rich dataset. For a deeper and a more hands-on look at this data, take a look at my Datalab workbook. Better, clone it, run your own analysis, and share your results! If we want to talk about the trends, outliers, and their causes on the web, then we need to understand this data at a much deeper level.
 Ilya Grigorik is a web ecosystem engineer, author of High Performance Browser Networking (O'Reilly), and Principal Engineer at Shopify — follow on Twitter.