High Performance Networking in Google Chrome
The following is a draft chapter for the upcoming "The Performance of Open Source Applications" (POSA), a sequel to The Architecture of Open Source Applications. POSA is a collection of essays about performance optimization, designing for performance, managing performance as part of a development process, and more. The book will be published in Spring 2013 under a Creative Commons license with royalties going to Amnesty International.
- History and guiding principles of Google Chrome
- The many facets of performance
- What is a modern web application?
- The life of a resource request on the wire
- What is "fast enough"?
- Chrome's network stack from 10,000 feet
- Lifetime of your browser session...
- Optimizing the cold-boot experience
- Optimizing interactions with the Omnibox
- Optimizing DNS with prefetching
- Optimizing TCP connection management with pre-connect
- Optimizing resource loading with prefetch hints
- Optimizing resource loading with browser prefreshing
- Optimizing navigation with prerendering
- Chrome gets faster as you use it
History and guiding principles of Google Chrome # ↑
Google Chrome was first released in the second half of 2008, as a beta version for the Windows platform. The Google-authored code powering Chrome was also made available under a permissive BSD license - aka, the Chromium project. To many observers, this turn of events came as a surprise: the return of the browser wars? Could Google really do much better?
"It was so good that it essentially forced me to change my mind..." - Eric Schmidt, on his initial reluctance to the idea of developing Google Chrome.
 Turns out, they could. Today Chrome is one of the most widely used browsers on the web (35%+ of the market share according to StatCounter) and is now available on Windows, Linux, OS X, Chrome OS, as well as Android and iOS platforms. Clearly, the features and the functionality resonated with the users, and many innovations of Chrome have also found their way into other popular browsers.
The original 38-page comic book explanation of the ideas and innovations of Google Chrome offers a great overview of the thinking and design process behind the popular browser. However, this was only the beginning. The core principles that motivated the original development of the browser continue to be the guiding principles for ongoing improvements in Chrome:
- Speed: the objective is to make the fastest browser
- Security: provide the most secure environment to the user
- Stability: provide a resilient and stable web application platform
- Simplicity: sophisticated technology, wrapped in a simple user experience
As the team observed, many of the sites we use today aren't just web pages, they are applications. In turn, the ever more ambitious applications require speed, security, and stability. Each of these deserves its own dedicated chapter, but since our subject is performance, our focus will be primarily on speed.
The many facets of performance # ↑
A modern browser is a platform, just like your operating system, and Google Chrome is designed as such. Prior to Google Chrome, all major browsers were built as a monolithic, single process applications. All open pages shared the same address space and contended for the same resources. A bug in any page, or the browser, ran the risk of compromising the entire experience.
 By contrast, Chrome works on a multi-process model, which provides process and memory isolation, and a tight security sandbox for each tab. In an increasingly multi-core world, the ability to isolate the processes as well as shield each open tab from other misbehaving pages has by itself proven to give Chrome a significant performance edge over the competition. In fact, it is important to note that most other browsers have followed suit, or are in the process of migrating to similar architecture.
With an allocated process in place, the execution of a web program primarily involves three tasks: fetching resources, page layout and rendering, and JavaScript execution. The rendering and script steps follow a single-threaded, interleaved model of execution - it is not possible to perform concurrent modifications of the resulting Document Object Model (DOM). This is in part due to the fact that JavaScript itself is a single threaded language. Hence, optimizing how the rendering and script execution runtimes work together is of critical importance, both to the web developers building the applications as well as the developers working on the browser.
For rendering, Chrome uses Blink, which is a fast, open-source, and standards compliant layout engine. For JavaScript, Chrome ships with its own, heavily optimized "V8" JavaScript runtime, which was also released as a standalone open-source project and has found its way into many other popular projects - e.g., runtime for node.js. However, optimizing V8 JavaScript execution, or the Blink parsing and rendering pipelines won't do much good if the browser is blocked on the network, waiting for the resources to arrive!
The ability of the browser to optimize the order, priority, and latency of each network resource is one of the most critical contributors to the overall user experience. You may not be aware of it, but Chrome's network stack is, quite literally, getting smarter every day, trying to hide or decrease the latency cost of each resource: it learns likely DNS lookups, it remembers the topology of the web, it preconnects to likely destination targets, and more. From the outside, it presents itself as a simple resource fetching mechanism, but from the inside it is an elaborate and a fascinating case study for how to optimize web performance and deliver the best experience to the user.
Let's dive in...
What is a modern web application? # ↑
Before we get to the tactical details of how to optimize our interaction with the network, it helps to understand the trends and the landscape of the problem we are up against. In other words, what does a modern web page, or application look like?
The HTTP Archive project tracks how the web is built, and it can help us answer this question. Instead of crawling the web for the content, it periodically crawls the most popular sites to record and aggregate analytics on the number of used resources, content types, headers, and other metadata for each individual destination. The stats, as of January 2013, may surprise you. An average page, amongst the top 300,000 destinations on the web is:
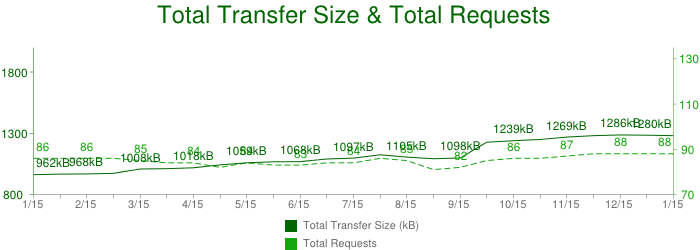
- 1280 KB in size
- composed of 88 resources
- connects to 15+ distinct hosts
Let that sink in. Over 1MB in size on average, composed of 88 resources such as images, JavaScript, and CSS, and delivered from 15 different own and third-party hosts! Further, each of these numbers have been steadily increasing over the past few years, and there are no signs of stopping. We are increasingly building larger and more ambitious web applications.
Applying basic math to the HTTP Archive numbers reveals that an average resource is about 12KB in size (1045 KB / 84 resources), which means that most network transfers in the browser are short and bursty. This presents its own set of complications because the underlying transport (TCP) is optimized for large, streaming downloads. Let's peel back the onion and inspect one of these network requests...
The life of a resource request on the wire # ↑
The W3C Navigation Timing specification provides a browser API and visibility into the timing and performance data behind the life of every request in the browser. Let's inspect the components, as each is a critical piece of delivering the optimal user experience:

Given the URL of a resource on the web, the browser starts by checking its local and application caches. If you have previously fetched the resource and the appropriate cache headers were provided (Expires, Cache-Control, etc.), then it is possible that we may be allowed to use the local copy to fulfill the request - the fastest request is a request not made. Alternatively, if we have to revalidate the resource, if it expired, or if we simply haven't seen it before, then a costly network request must be dispatched.
Given a hostname and resource path, Chrome first checks for existing open connections it is allowed to reuse - sockets are pooled by {scheme, host, port}. Alternatively, if you have configured a proxy, or specified a proxy auto-config (PAC) script, then Chrome checks for connections through the appropriate proxy. PAC scripts allow for different proxies based on URL, or other specified rules, each of which can have its own socket pool. Finally, if neither of the above conditions is matched, then the request must begin by resolving the hostname to its IP address - aka, a DNS lookup.
If we are lucky, the hostname may already be cached in which case the response is usually just one quick system call away. If not, then a DNS query must be dispatched before any other work can happen. The time taken to do the DNS lookup will vary based on your internet provider, the popularity of the site and the likelihood of the hostname to be in intermediate caches, as well as the response time of the authoritative servers for that domain. In other words, there are a lot of variables at play, but it's not unusual for a DNS lookup to take up to several hundred milliseconds - ouch.
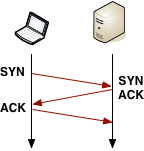 With the resolved IP address in hand, Chrome can now open a new TCP connection to the destination, which means that we must perform the "three-way handshake":
 SYN > SYN-ACK > ACK. This exchange adds a full roundtrip of latency delay to each and every new TCP connection - no shortcuts. Depending on the distance between the client and the server, as well as the chosen routing path, this can yield from tens to hundreds, or even thousands, of milliseconds of delay. All of this work and latency is before even a single byte of application data has hit the wire!
Once the TCP handshake is complete, and if we're connecting to a secure destination (HTTPS), then the SSL handshake must take place. This can add up to two additional roundtrips of latency delay between client and server. If the SSL session is cached, then we can "escape" with just one additional roundtrip.
Finally, Chrome is able to dispatch the HTTP request (requestStart in the Nav Timing figure above). Once received, the server can process the request and then stream the response data back to the client. This incurs a minimum of a network roundtrip, plus the processing time on the server. Following that, we're done. Well, that is unless the actual response is an HTTP redirect! In which case, we may have to repeat the entire cycle once over. Have a few gratuitous redirects on your pages? You may want to revisit that decision!
Have you been counting all the delays? To illustrate the problem, let's assume the worst case scenario for a typical broadband connection: local cache miss, followed by a relatively fast DNS lookup (50 ms), TCP handshake, SSL negotiation, and a relatively fast (100 ms) server response time, with a round-trip time of 80 ms (an average round-trip across continental USA):
- 50ms for DNS
- 80ms for TCP handshake (one RTT)
- 160ms for SSL handshake (two RTT's)
- 40ms for request to server
- 100ms for server processing
- 40ms for response from the server
That's 470 milliseconds for a single request, which translates to over 80% of network latency overhead as compared to the actual server processing time to fulfill the request - we have some work to do here! In fact, even 470 milliseconds may be an optimistic estimate:
- If the server response does not fit into the initial TCP congestion window (4-15 KB), then one or more additional roundtrips of latency is introduced
- SSL delays could get even worse if we need to fetch a missing certificate or perform an online certificate status check (OCSP), both of which will require an entirely new TCP connection, which can add hundreds and even thousands of milliseconds of additional latency
What is "fast enough"? # ↑
The network overhead of DNS, handshakes, and the roundtrip times is what dominates the total time in our earlier case - the server response time accounts for only 20% of the total latency! But, in the grand scheme of things, do these delays even matter? If you are reading this, then you probably already know the answer: yes, very much so.
Past user experience research paints a consistent picture in what we, as users, expect in terms of responsiveness of any applications, both offline and online:
| Delay | User Reaction |
| 0 - 100ms | Instant |
| 100 - 300ms | Small perceptible delay |
| 300 - 1000ms | Machine is working |
| 1s+ | Mental context switch |
| 10s+ | I'll come back later... |
The table above also explains the unofficial rule of thumb in the web performance community: render your pages, or at the very least, provide visual feedback in under 250 ms to keep the user engaged. This is not speed simply for speed's sake. Studies at Google, Amazon, Microsoft, as well as thousands of other sites show that additional latency has a direct impact on the bottom line of your site: faster sites yield more pageviews, higher engagement from the users, and see higher conversion rates.
So, there you have it, our optimal latency budget is 250 ms, and yet as we saw in the example above, the combination of a DNS lookup, the TCP and SSL handshakes, and propagation times for the request add up to 370 ms. We're 50% over budget, and we still haven't factored in the server processing time!
To most users and even web-developers, the DNS, TCP, and SSL delays are entirely transparent and are negotiated at network layers to which few of us descend or think about. And yet, each of these steps is critical to the overall user experience, since each extra network request can add tens or hundreds of milliseconds of latency. This is the reason why Chrome's network stack is much, much more than a simple socket handler.
Now that we've identified the problem, let's dive into the implementation details...
Chrome's network stack from 10,000 feet # ↑
Multi-process architecture # ↑
Chrome's multi-process architecture carries important implications for how each network request is handled within the browser. Under the hood, Chrome actually supports four different execution models that determine how the process allocation is performed.
By default, desktop Chrome browsers use the process-per-site model, that isolates different sites from each other, but groups all instances of the same site into the same process. However, to keep things simple, let's assume one of the simplest cases: one distinct process for each open tab. From the network performance perspective, the differences here are not substantial, but the process-per-tab model is much easier to understand.

The architecture dedicates one render process to each tab, which itself contains an instance of the Blink open-source layout engine for interpreting and layout out the HTML (aka, "HTML Renderer" in the diagram), an instance of the V8 JavaScript engine, and the glue code to bridge these and a few other components. If you are curious, the Chromium wiki contains a great introduction to the plumbing.
Each of these "render" processes is executed within a sandboxed environment that has limited access to the user's computer - including the network. To gain access to these resources, each render process communicates with the browser (kernel) process, which is able to impose security and access policies on each renderer.
Inter-process communication (IPC) and Multi-process resource loading # ↑
All communication between the renderer and the kernel process in Chrome is done via IPC. On Linux and OSX, a socketpair() is used, which provides a named pipe transport for asynchronous communication. Each message from the renderer is serialized and passed to a dedicated I/O thread, which dispatches it to the kernel process. On the receiving end, the kernel process provides a filter interface, which allows Chrome to intercept resource IPC requests (see ResourceMessageFilter) which should be handled by the network stack.
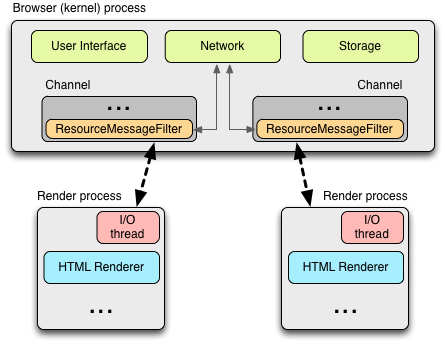
One of the advantages of this architecture is that all resource requests are handled entirely on the I/O threads and neither any UI generated activity, or network events interfere with each other. The resource filter runs in the I/O thread in the browser process, intercepts the resource request messages, and forwards them to a ResourceDispatcherHost singleton in the browser process.
The singleton interface allows the browser to control each renderer's access to the network, but it also enables efficient, and consistent resource sharing:
- Socket pool and connection limits: the browser is able to enforce limits on the number of open sockets per profile (256), proxy (32), and
{scheme, host, port}(6) groups. Note that this allows up to six HTTP and six HTTPS connections to the same{host, port}! - Socket reuse: persistent TCP connections are retained in the socket pool for some time after servicing the request to enable connection reuse, which avoids the extra DNS, TCP, and SSL (if required) setup overhead imposed on each new connection.
- Socket late-binding: requests are associated with an underlying TCP connection only once the socket is ready to dispatch the application request, allowing better request prioritization (e.g., arrival of a higher priority request while the socket was connecting), better throughput (e.g., re-use of a "warm" TCP connection in cases where an existing socket becomes available while a new connection is being opened), as well as a general-purpose mechanism for TCP pre-connect, and a number of other optimizations.
- Consistent session state: authentication, cookies, and cached data is shared between all render processes.
- Global resource and network optimizations: the browser is able to make decisions across all render processes and outstanding requests. For example, giving network priority to the requests initiated by the foreground tab.
- Predictive optimizations: by observing all network traffic, Chrome is able to build and refine predictive models to improve performance.
- ... and the list goes on.
As far as the render process is concerned, it is simply sending a resource request message over IPC, which is tagged with a unique request ID to the browser process, and the browser kernel process handles the rest.
Cross-platform resource fetching # ↑
 One of the chief concerns in the implementation of Chrome's network stack is portability across many different platforms: Linux, Windows, OS X, Chrome OS, Android, and iOS. To address this challenge, the network stack is implemented as a mostly single-threaded (there are separate cache and proxy threads), cross-platform library, which allows Chrome to reuse the same infrastructure and provide the same performance optimizations, as well as a greater opportunity for optimization across all platforms.
All of the network code is, of course, open source and can be found in the "src/net" subdirectory. We won't examine each component in detail, but the layout of the code itself tells you a lot about its capabilities and structure. A few examples:
| net/android | Bindings to the Android runtime |
| net/base | Common net utilities, such as host resolution, cookies, network change detection, and SSL certificate management |
| net/cookies | Implementation of storage, management, and retrieval of HTTP cookies |
| net/disk_cache | Disk and memory cache implementation for web resources |
| net/dns | Implementation of an asynchronous DNS resolver |
| net/http | HTTP protocol implementation |
| net/proxy | Proxy (SOCKS and HTTP) configuration, resolution, script fetching, ... |
| net/socket | Cross-platform implementations of TCP sockets, SSL streams, and socket pools |
| net/spdy | SPDY protocol implementation |
| net/url_request | URLRequest, URLRequestContext, and URLRequestJob implementations |
| net/websockets | WebSockets protocol implementation |
Each of the above makes for a great read for the curious - the code is well documented, and you'll find plenty of unit tests for every component.
Architecture and performance on mobile platforms # ↑
 Mobile browser usage is growing at an exponential rate and even by modest projections, it will eclipse desktop browsing in the not so distant future. Needless to say, delivering an optimized mobile experience has been a top priority for the Chrome team. In early 2012, Chrome for Android was announced, and a few months later, Chrome for iOS followed.
The first thing to note about the mobile version of Chrome, is that it's not simply a direct adaptation of the desktop browser - that would not deliver the best user experience. By its very nature, the mobile environment is both much more resource constrained, and has many fundamentally different operating parameters:
- Desktop users navigate with the mouse, may have overlapping windows, have a large screen, are mostly not power constrained, usually have a much more stable network connection, and have access to much larger pools of storage and memory.
- Mobile users use touch and gesture navigation, have a much smaller screen, are battery and power constrained, are often on metered connections, and have limited local storage and memory.
Further, there is no such thing as a "typical mobile device". Instead there is a wide range of devices with varying hardware capabilities, and to deliver the best performance, Chrome must to adapt to the operating constraints of each and every device. Thankfully, the various execution models allow Chrome to do exactly that!
 On Android devices, Chrome leverages the same multi-process architecture as the desktop version - there is a browser process, and one or more renderer processes. The one difference is that due to memory constraints of the mobile device, Chrome may not be able to run a dedicated renderer for each open tab. Instead, Chrome determines the optimal number of renderer processes based on available memory, and other constraints of the device, and shares the renderer process between the multiple tabs.
In cases where only minimal resources are available, or if Chrome is unable to run multiple processes, it can also switch to use a single-process, multi-threaded processing model. In fact, on iOS devices, due to sandboxing restrictions of the underlying platform, it does exactly that - it runs a single, but multi-threaded process.
What about network performance? First off, Chrome uses the same network stack on Android and iOS, as it does on all other versions. This enables all of the same network optimizations across all platforms, which gives Chrome a significant performance advantage. However, what is different, and is often adjusted based on the capabilities of the device and the network in use, are variables such as priority of speculative optimization techniques, socket timeouts and management logic, cache sizes, and more.
For example, to preserve battery, mobile Chrome may opt-in to use lazy closing of idle sockets - sockets are closed only when opening new ones to minimize radio use. Similarly, since prerendering (which we will discuss below), may require significant network and processing resources, it is often only enabled when the user is on Wi-Fi.
Optimizing the mobile browsing experience is one of the highest priority items for the Chrome development team, and we can expect to see a lot of new improvements in the months and years to come. In fact, it is a topic that deserves its own separate chapter - perhaps in the next installment of the POSA series!
Speculative optimization with Chrome's Predictor # ↑
 Chrome gets faster as you use it. This feat is accomplished with the help of a singleton
 Predictor object, which is instantiated within the browser kernel process, and whose sole responsibility is to observe network patterns and to learn and anticipate likely user actions in the future. A few example signals processed by the Predictor include:
- Users hovering their mouse over a link is a good indicator of a likely, upcoming navigation event, which Chrome can help accelerate by dispatching a speculative DNS lookup of the target hostname, as well as potentially starting the TCP handshake. By the time the user clicks, which takes ~200 ms on average, there is a good chance that we have already completed the DNS and TCP steps, allowing us to eliminate hundreds of milliseconds of extra latency for the navigation event.
- Typing in the Omnibox (URL) bar triggers high-likelihood suggestions, which may similarly kick off a DNS lookup, TCP pre-connect, and can even pre-render the page in a hidden tab!
- Each one of us has a list of favorite sites that we visit every day. Chrome can learn the subresources on these sites and speculatively pre-resolve and perhaps even pre-fetch them to accelerate the browsing experience. And the list goes on...
Chrome learns the topology of the web, as well as your own browsing patterns, as you use it. If it does the job well, it can eliminate hundreds of milliseconds of latency from each navigation and get the user closer to the holy grail of the "instant page load". To achieve this goal, Chrome leverages four core optimization techniques:
| DNS pre-resolve | resolve hostnames ahead of time, to avoid DNS latency |
| TCP pre-connect | connect to destination server ahead of time, to avoid TCP handshake latency |
| Resource prefetching | fetch critical resources on the page ahead of time, to accelerate rendering of the page |
| Page prerendering | fetch the entire page with all of its resources ahead of time, to enable instant navigation when triggered by the user |
Each decision to invoke one or several of these techniques is optimized against a large number of constraints. After all, each is a speculative optimization, which means that if done poorly, it might trigger unnecessary work and network traffic, or even worse, have a negative effect on the loading time for an actual navigation triggered by the user.
How does Chrome address this problem? The predictor consumes as many signals as it can, which include user generated actions, historical browsing data, as well as signals from the renderer and the network stack itself.
Not unlike the ResourceDispatcherHost, which is responsible for coordinating all of the network activity within Chrome, the Predictor object creates a number of filters on user and network generated activity within Chrome:
- IPC channel filter to monitor for signals from the render processes
ConnectInterceptorobject is added to each request, such that it can observe the traffic patterns and record success metrics for each request
As a hands on example, the render process can trigger a message to the browser process with any of the following hints, which are conveniently defined in ResolutionMotivation (url_info.h):
enum ResolutionMotivation {
  MOUSE_OVER_MOTIVATED,     // Mouse-over initiated by the user.
  OMNIBOX_MOTIVATED,        // Omni-box suggested resolving this.
  STARTUP_LIST_MOTIVATED,   // This resource is on the top 10 startup list.
  EARLY_LOAD_MOTIVATED,     // In some cases we use the prefetcher to warm up
                            // the connection in advance of issuing the real
                            // request.

  // The following involve predictive prefetching, triggered by a navigation.
  // The referring_url_ is also set when these are used.
  STATIC_REFERAL_MOTIVATED,  // External database suggested this resolution.
  LEARNED_REFERAL_MOTIVATED, // Prior navigation taught us this resolution.
  SELF_REFERAL_MOTIVATED,    // Guess about need for a second connection.

  // <snip> ...
};
Given such a signal, the goal of the predictor is to evaluate the likelihood of its success, and then to trigger the activity if resources are available. Every hint may have a likelihood of success, a priority, and an expiration timestamp, the combination of which can be used to maintain an internal priority queue of speculative optimizations. Finally, for every dispatched request from within this queue, the predictor is also able to track its success rate, which allows it to further optimize its future decisions.
Chrome network architecture in a nutshell # ↑
- Chrome uses a multi-process architecture, which isolates render processes from the browser process
- Chrome maintains a single instance of the resource dispatcher, which is shared across all render processes, and runs within the browser kernel process
- The network stack is a cross-platform, (mostly) single-threaded library
- The network stack uses non-blocking operations to manage all network operations
- Shared network stack allows efficient resource prioritization, reuse, and provides the browser with ability to perform global optimization across all running processes
- Each render process communicates with the resource dispatcher via IPC
- Resource dispatcher intercepts resource requests via a custom IPC filter
- Predictor intercepts resources request and response traffic to learn and optimize future network requests
- Predictor may speculatively schedule DNS, TCP, and even resource requests based on learned traffic patterns, saving hundreds of milliseconds when the navigation is triggered by the user
Lifetime of your browser session... # ↑
With the 10,000 foot architecture view of the Chrome network stack in mind, let's now take a closer look at the kinds of user-facing optimizations enabled within the browser. Specifically, let's imagine we have just created a new Chrome profile and are ready to start our day.
Optimizing the cold-boot experience # ↑
 The first time you load your browser, it of course knows little about your favorite sites or navigation patterns. But, as it turns out, many of us follow the same routine after a cold-boot of the browser, where we may navigate to our email inbox, favorite news site, a social site, an internal portal, and so on. The specific sites will, of course, vary, but the similarity of all these sessions allows the Chrome predictor to accelerate your cold-boot experience!
Chrome remembers the top ten likely hostnames accessed by the user following the browser start - note that this is not the top ten global destinations, but specifically the destinations following a fresh browser start. As the browser loads, Chrome can trigger a DNS pre-fetch for the likely destinations! If you are curious, you can inspect your own startup hostname list by opening a new tab and navigating to chrome://dns. At the top of the page, you will find the list of the top ten likely startup candidates for your profile.

Above screenshot is an example from my own Chrome profile. How do I usually begin my browsing? Frequently by navigating to Google Docs if I'm working on an article such at this one. Not surprisingly, we see a lot of Google hostnames in the list!
Optimizing interactions with the Omnibox # ↑
 One of the innovations of Chrome was the introduction of the Omnibox, which unlike its predecessors handles much more than just destination URLs. Besides remembering the URLs of pages that the user visited in the past, it also offers full text search over your history (tip: instead of the URL, try typing the name of the page you've recently visited), as well as a tight integration with the search engine of your choice.
As the user types, the Omnibox automatically proposes an action, which is either a URL based on your navigation history, or a search query. Under the hood, each proposed action is scored with respect to the query, as well as its past performance. In fact, Chrome allows us to inspect this data by visiting chrome://predictors.
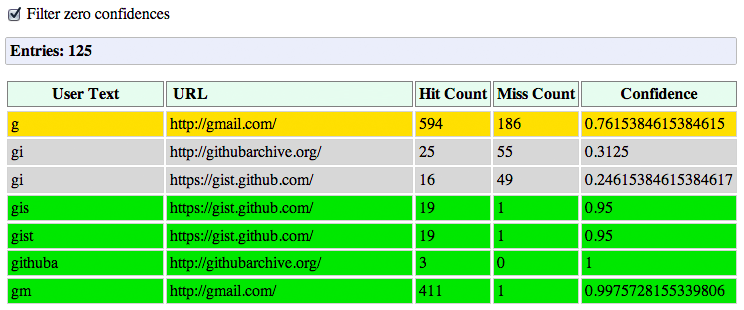
Chrome maintains a history of the user entered prefixes, the actions it has proposed, as well as the hit rate for each one. For my own profile, you can see that whenever I enter "g" in the Omnibox, there is a 76% chance that I'm heading to Gmail. Once I add an "m" (for "gm"), then the confidence rises to 99.8% - in fact, out of the 412 recorded visits, I didn't end up going to Gmail, after entering "gm" only once!
But, you're thinking, what does this have to do with the network stack? Well, the yellow and green colors for the likely candidates are also important signals for the ResourceDispatcher! If we have a likely candidate (yellow), Chrome may trigger a DNS pre-fetch for the target host. If we have a high confidence candidate (green), then Chrome may also trigger a TCP pre-connect once the hostname has been resolved. And finally, if both complete while the user is still deliberating, then Chrome may even pre-render the entire page in a hidden tab.
Alternatively, if there is no good match for the entered prefix based on past navigation history, then Chrome may issue a DNS pre-fetch and TCP pre-connect to your search provider, in anticipation of a likely search request.
An average user takes hundreds of milliseconds to fill in their query and to evaluate the proposed autocomplete suggestions. In the background, Chrome is able to pre-fetch, pre-connect, and in certain cases even pre-render the page, such that by the time the user is ready to hit the "enter" key, much of the network latency has already been eliminated!
Optimizing cache performance # ↑
The best, and the fastest request, is a request not made. Whenever we talk about performance, we would be amiss if we didn't talk about the cache -- you are providing Expires, ETag, Last-Modified, and Cache-Control response headers for all the resources on your pages, right? If not, stop, go fix it, we'll wait.
 Chrome has two different implementations of the internal cache: one backed by local disk, and second which stores everything in memory. The in-memory implementation is used for the Incognito browsing mode and is wiped clean whenever you close the window. Both implement the same internal interface (
disk_cache::Backend, and disk_cache::Entry), which greatly simplifies the architecture - and if you are so inclined, allows you to easily experiment with your own, experimental cache implementations.
Internally, the disk cache implements its own set of data structures, all of which are stored within a single cache folder for your profile. Inside this folder, there are index files, which are memmapped when the browser starts, and data files which store the actual data, alongside the HTTP headers and other bookkeeping information. As an interesting sidenote, resources up to 16KB in size are stored in shared data block-files, and larger files get their own dedicated files on disk. Finally, for eviction, the disk cache maintains an LRU which uses ranking metrics such as frequency of access and age of resource into account.
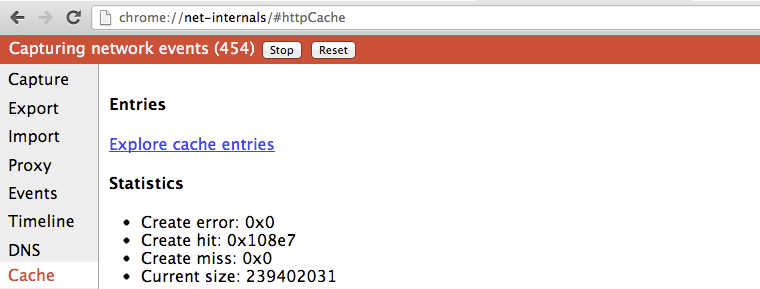
If you are ever curious about the state of the Chrome cache, open a new tab and navigate to chrome://net-internals/#httpCache. Alternatively, if you want to see the actual HTTP metadata and the cached response, you can also visit chrome://cache, which will enumerate all of the resources currently available in the cache. From that page, search for a resource you're looking for and click on the URL to see the exact, cached headers and response bytes.
Optimizing DNS with prefetching # ↑
We have already mentioned DNS pre-resolution on several occasions, so before we dive into the implementation, let's review the cases in which it may be triggered, and why:
- The Blink document parser, which runs in the render process, may provide a list of hostnames for all the links on the current page, which Chrome may, or may not choose to pre-resolve ahead of time.
- Renderer process may trigger a mouse hover or "button down" event as an early signal of user's intent to perform a navigation.
- The Omnibox may trigger a resolve request based on a high likelihood suggestion.
- Chrome predictor may request hostname resolution based on past navigation and resource request data - more on this below.
- The owner of the page may explicitly indicate to Chrome which hostnames it should pre-resolve.
In all cases, DNS pre-resolution is treated as a hint. Chrome does not guarantee that the pre-resolution will occur, rather it uses each signal in combination with its own predictor to assess the hint and decide on a course of action. In the "worst case", if we weren't able to pre-resolve the hostname in time, the user would have to wait for an explicit DNS resolution, followed by TCP connection time, and finally the actual resource fetch. However, when this occurs, the predictor can take note and adjust its future decisions accordingly - it gets faster, and smarter, as you use it.
One of the optimizations we have not covered previously is the ability of Chrome to learn the topology of each site and then use this information to accelerate future visits. Specifically, recall that an average page consists of 88 resources, which are delivered from 30+ distinct hosts. Well, each time you perform a navigation, Chrome may record the hostnames for the popular resources on the page, and during a future visit, it may choose to trigger a DNS pre-resolve and even a TCP pre-connect for some, or all of them!
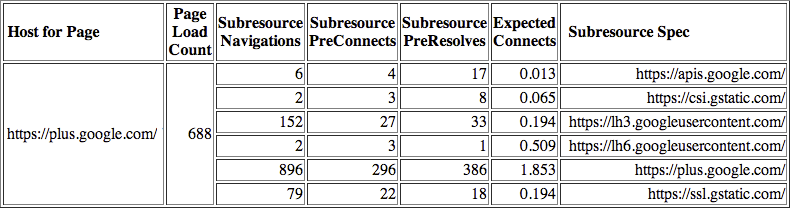
To inspect the subresource hostnames stored by Chrome, navigate to chrome://dns and search for any popular destination hostname for your profile. In the example above, you can see the six subresource hostnames that Chrome remembered for Google+, as well as stats for the number of cases when a DNS pre-resolution was triggered, or a TCP pre-connect was performed, as well as an expected number of requests that will be served by each. This internal accounting is what enables the Chrome predictor to perform its optimizations.
In addition to all of the internal signals, the owner of the site is also able to embed additional markup on their pages to request the browser to pre-resolve a hostname:
<link rel="dns-prefetch" href="//host_name_to_prefetch.com">Why not simply rely on the automated machinery in the browser? In some cases, you may want to pre-resolve a hostname which is not mentioned anywhere on the page. The canonical example is, of course, redirects: a link may point to a host, like an analytics tracking service, which then redirects the user to the actual destination. By itself, Chrome cannot infer this pattern, but you can help it by providing a manual hint and get the browser to resolve the hostname of the actual destination ahead of time.
So, how is this all implemented under the hood? The answer to this question, just like all other optimizations we have covered, depends on the version of Chrome, since the team is always experimenting with new and better ways to improve performance. However, broadly speaking, the DNS infrastructure within Chrome has two major implementations: historically, Chrome has relied on the platform-independent getaddrinfo() system call, and delegated the actual responsibility for the lookups to the operating system, however this approach is in the process of being replaced with Chrome's own implementation of an asynchronous DNS resolver.
The original implementation, which relied on the operating system, has its benefits: less and simpler code, and the ability to leverage the operating system's DNS cache. However, getaddrinfo() is also a blocking system call, which meant that Chrome had to create and maintain a dedicated worker thread-pool to allow it to perform multiple lookups in parallel. This unjoined pool was capped at six worker threads, which is an empirical number based on lowest common denominator of hardware - turns out, higher numbers of parallel requests can overload some users' routers!
For pre-resolution with the worker-pool, Chrome simply dispatches the getaddrinfo() call, which blocks the worker thread until the response is ready, at which point it just discards the returned result and begins processing the next prefetch request. Discards it? The result is cached by the OS DNS daemon cache, which returns an immediate response to future, actual getaddrinfo() lookups. Simple, effective, works well enough in practice.
Well, effective, but not good enough! The getaddrinfo() call hides a lot of useful information from Chrome, such as the time-to-live (TTL) timestamps for each record, as well as the state of the DNS cache itself. To improve performance, Chrome team decided to implement their own, cross-platform, asynchronous DNS resolver.

By moving DNS resolution into Chrome the new async resolver enables a number of new optimizations:
- better control of retransmission timers, and ability to execute multiple queries in parallel
- visibility into record TTLs, which allows Chrome to refresh popular records ahead of time
- better behavior for dual stack implementations (IPv4 and IPv6)
- failovers to different servers, based on RTT or other signals
All of the above, and more, are ideas for continuous experimentation and improvement within Chrome. Which brings us to the obvious question: how do we know and measure the impact of these ideas? Simple, Chrome tracks detailed network performance stats and histograms for each individual profile. To inspect the collected DNS metrics, open a new tab, and head to chrome://histograms/DNS.
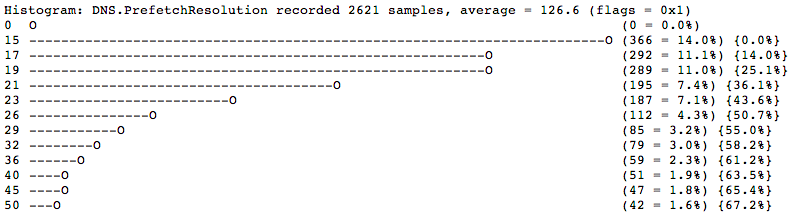
The above histogram shows the distribution of latencies for DNS prefetch requests: roughly 50% (rightmost column) of the prefetch queries were finished within 20ms (leftmost column). Note that this is data based on a recent browsing session (9869 samples), and is private to the user. If the user has opted in to report their usage stats in Chrome, then the summary of this data is anonymized and periodically beaconed back to the engineering team, which is then able to see the impact of their experiments and adjust accordingly. Rinse, lather, repeat.
Optimizing TCP connection management with pre-connect # ↑
We have pre-resolved the hostname and we have a high likelihood navigation event that's about to happen, as estimated by the Omnibox, or the Chrome predictor. Why not go one step further, and also speculatively pre-connect to the destination host and complete the TCP handshake before the user dispatches the request? By doing so, we can eliminate another full round-trip of latency delay, which can easily save hundreds of milliseconds for the user. Well, that's exactly what TCP-preconnect is and how it works!
To see the hosts for which a TCP preconnect has been triggered, open a new tab and visit chrome://dns.

First, Chrome checks its socket pools to see if there is an available socket for the hostname, which it may be able to reuse - keep-alive sockets are kept in the pool for some period of time, to avoid the TCP handshake and slow-start penalties. If no socket is available, then it can initiate the TCP handshake, and place it in the pool. Then, when the user initiates the navigation, the HTTP request can be dispatched immediately.
Curious to see the state of all the open sockets in Chrome? Simple, head to: chrome://net-internals#sockets

Note that you can also drill into each socket and inspect the timeline: connect and proxy times, arrival times for each packet, and more. Last but not least, you can also export this data for further analysis or a bug report. Having good instrumentation is key to any performance optimization, and chrome://net-internals is the nexus of all things networking in Chrome - if you haven't explored it yet, you should!
Optimizing resource loading with prefetch hints # ↑
Sometimes, the author of a page is able to provide additional navigation, or page context, based on the structure or the layout of their site, and help the browser optimize the experience for the user. Chrome supports two such hints, which can be embedded in the markup of the page:
  <link rel="subresource" href="/javascript/myapp.js">
  <link rel="prefetch"    href="/images/big.jpeg">
Subresource and prefetch look very similar, but have very different semantics. When a link resource specifies its relationship as "prefetch", it is an indication to the browser that this resource might be needed in a future navigation. In other words, effectively it is a cross-page hint. By contrast, when a resource specifies the relationship as a "subresource", it is an early indication to the browser that the resource will be used on a current page, and that it may want to dispatch the request before it encounters it later in the document.
As you would expect, the different semantics of the hints lead to very different behavior by the resource loader. Resources marked with prefetch are considered low priority and might be downloaded by the browser only once the current page has finished loading. Whereas subresource resources are fetched with high priority as soon as they are encountered and will compete with the rest of the resources on the current page.
Both hints, when used well and in the right context, can help significantly with optimizing the user experience on your site. Finally, it is also important to note that prefetch is part of the HTML5 spec, and as of today supported by Firefox and Chrome, whereas subresource is currently only available in Chrome.
Optimizing resource loading with browser prefreshing # ↑
Unfortunately, not all site owners are able or willing to provide the browser with subresource hints in their markup. Further, even if they do, we must wait for the HTML document to arrive from the server before we are able to parse the hints and begin fetching the necessary subresources - depending on the server response time, as well as the latency between the client and the server, this could take hundreds and even thousands of milliseconds.
However, as we saw earlier, Chrome is already learning the hostnames of the popular resources to perform DNS pre-fetching. So, why couldn't it do the same, but go one step further and perform the DNS lookup, use TCP preconnect, and then also speculatively prefetch the resource? Well, that's exactly what "prefreshing" could do:
- User initiates a request to a target URL
- Chrome queries its Predictor for learned subresources associated with target URL and initiates the sequence of DNS prefetch, TCP preconnect, and resource prefreshing
- If the learned subresource is in the cache, then its loaded from disk and into memory
- If the learned subresource is missing, or has expired, then a network request is made
 Resource prefreshing is a great example of the workflow of every experimental optimization in Chrome - in theory, it should enable better performance, but there are many tradeoffs as well. There is only one way to reliably determine if it will make the cut and make it into Chrome: implement it and run it as A/B experiment in some of the pre-release channels with real users, on real networks, with real browsing patterns.
As of early 2013, the Chrome team is in the early stages of discussing the implementation. If it makes the cut based on gathered results, we may see prefreshing in Chrome sometime later in the year. The process of improving Chrome network performance never stops, the team is always experimenting with new approaches, ideas, and techniques.
Optimizing navigation with prerendering # ↑
Each and every optimization we have covered up to now helps reduce the latency between the user's direct request for a navigation and the resulting page rendering in their tab. However, what would it take to have a truly instant experience? Based on the UX data we saw earlier, this interaction would have to happen in less than 100 milliseconds, which doesn't leave much room for network latency at all. What could we do to deliver a rendered page in sub 100 milliseconds?
Of course, you already know the answer, since this is a common pattern employed by many users: if you open multiple tabs then switching between tabs is instant and is definitely much faster than waiting for the navigation between the same resources in a single foreground tab. Well, what if the browser provided an API to do this?
<link rel="prerender" href="http://example.org/index.html">You guessed it, that's prerendering in Chrome! Instead of just downloading a single resource, as the "prefetch" hint would have done, the "prerender" attribute indicates to Chrome that it should, well, prerender the page in a hidden tab, along with all of its subresources. The hidden tab itself is invisible to the user, but when the user triggers the navigation, the tab is swapped in from the background for an "instant experience".
Curious to try it out? You can visit prerender-test.appspot.com for a hands on demo, and see the history and status of the prerendered pages for your profile by visiting: chrome://net-internals/#prerender

As you would expect, rendering an entire page in a hidden tab can consume a lot of resources, both CPU and network, and hence should only be used in cases where we have high confidence that the hidden tab will be used! For example, when you are using the Omnibox, a prerender may be triggered for the a high confidence suggestion. Similarly, Google Search sometimes adds the prerender hint to its markup if it estimates that the first search result is a highly confidence destination (aka, Google Instant Pages):
Note that you can also add prerender hints to your own site! However, before you do, note that prerendering has a number of restrictions and limitations, which you should keep in mind:
- At most one prerender tab is allowed across all processes
- HTTPS and pages with HTTP authentication are not allowed
- Prerendering is abandoned if the requested resource, or any of its subresources need to make a non-idempotent request (only GET requests allowed)
- All resources are fetched with lowest network priority
- The page is rendered with lowest CPU priority
- The page is abandoned if memory requirements exceed 100MB
- Plugin initialization is deferred, and pre-rendering is abandoned if an HTML5 media element is present
In other words, prerendering is not guaranteed to happen and only applies to pages where it is safe. Additionally, since JavaScript and other logic may be executed within the hidden page, it is best practice to leverage the Page Visibility API to detect if the page is visible - which is something you should be doing anyway!
Chrome gets faster as you use it # ↑
 Needless to say, Chrome's network stack is much more than a simple socket manager. Our whirlwind tour covered the many levels of potential optimizations that are performed transparently in the background, as you navigate the web. The more Chrome learns about the topology of the web and your browsing patterns, the better it can do its job. Almost like magic, Chrome gets faster as you use it. Except, it's not magic, because now you know how it works!
Finally, it is important to note that the Chrome team continues to iterate and experiment with new ideas to improve performance - this process never stops. By the time you read this, chances are there will be new experiments and optimizations being developed, tested, or deployed. Perhaps once we reach our target destination of instant page loads (<100 ms), for each and every page, then we can take a break. Until then, there is always more work to do!
 Ilya Grigorik is a web ecosystem engineer, author of High Performance Browser Networking (O'Reilly), and Principal Engineer at Shopify — follow on Twitter.