Profiling Ruby With Google's Perftools
 Benchmarking, profiling and debugging are all areas where better tool support could really benefit the Ruby community. Built in benchmark library and extensions such as ruby-prof provide us with a minimal level of introspection to help identify the common bottlenecks, but they still fall short of the available tools for the JVM, or other dynamic runtimes.
If you're working with Rails, the story is better, as within the past year companies such as FiveRuns and New Relic have built a number of great performance and monitoring applications. However, if you're working on the bowels of the framework itself, or attempting to optimize a codepath in any other Ruby application, you're out of luck. For that reason, one interesting project to explore is perftools.rb, an adaptation of Google's perftools library to the Ruby land by Aman Gupta.
Hidden Gems in Google's Perftools: CPU + Heap profilers
Google's perftools library, which recently reached 1.0 status is largely known for its fast TCMalloc which offers impressive drop in speed improvements over the regular malloc (memory allocation). However, also hidden inside is a set of heap and CPU performance analysis and visualizations tools that are all too often overlooked.
At the moment perftools.rb only supports the CPU profiler, but the heap profiler is next on the agenda and offers a lot of promise. To get started, simply download and install the gem (gem install perftools.rb), the installer will download Google's perftools library, patch it on the fly to enable Ruby instrumentation and install it on your system. From here, you have two options on how to perform the profiling: explicitly instrument your code, or include the perftools library on the fly.
# instrument your code
require 'perftools'
PerfTools::CpuProfiler.start("/tmp/add_numbers_profile") do
  5_000_000.times{ 1+2+3+4+5 }
end

# profile existing application
CPUPROFILE=/tmp/my_app_profile RUBYOPT="-r`gem which perftools | tail -1`" ruby my_app.rb
The actual profiling of your code is done via a sampling process where the interpreter is interrupted on a periodic interval, the state is frozen for a few milliseconds and a snapshot of the stack is taken. This does mean that your process has to run for long enough for the profiler to collect a few samples (be careful with short scripts). Once the process is complete you can extract a quick text summary. For example, here is sample output for a simple Sinatra application:
$ CPUPROFILE=/tmp/sinatra RUBYOPT="-r`gem which perftools | tail -1`" ruby hello.rb
$ ab -c 10 -n 2000 localhost:4567/

$ pprof.rb --text --ignore=Gem /tmp/sinatra
# Total: 502 samples
#      180  35.9%  35.9%      412  82.1% EventMachine.run_machine
#      150  29.9%  65.7%      150  29.9% Time#initialize
#       38   7.6%  73.3%       38   7.6% garbage_collector
#       24   4.8%  78.1%       24   4.8% Time#-
#       17   3.4%  81.5%       17   3.4% String#split
#       10   2.0%  83.5%       10   2.0% IO#write
#        6   1.2%  84.7%        6   1.2% StringIO#size

# generate a visualization of the callstack
$ pprof.rb --gif /tmp/sinatra > /tmp/sinatra.gif
perftools.rb - Google-perftools for Ruby code
Visualizing Performance & Bottlenecks With pprof.rb
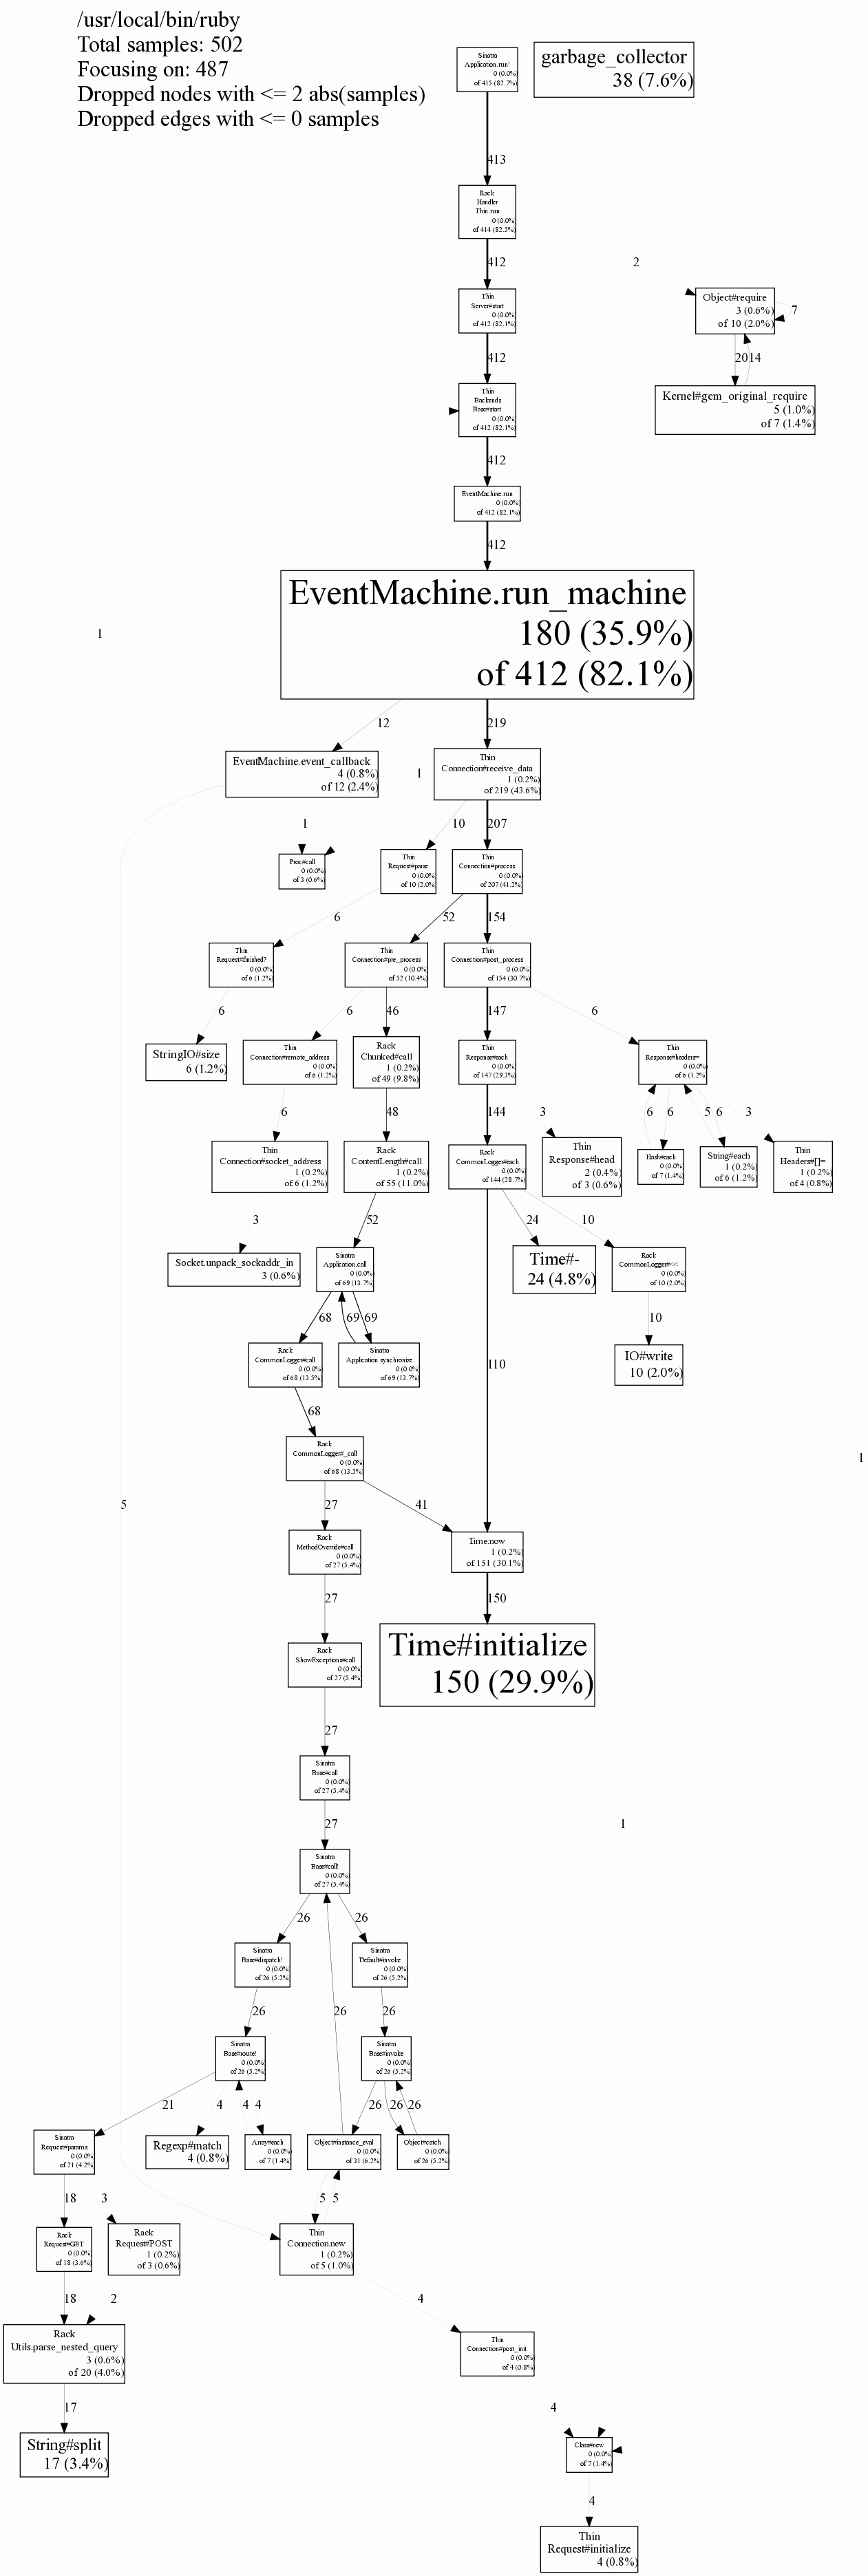 However, while the text analysis is definitely useful, the real gold nugget in Google's perftools library is its ability to visualize the profiling information. By converting our profiler output into GIF or PDF formats, we immediately find several interesting codepaths in our Sinatra application (click on preview): majority of the time is spent in EventMachine (as expected), about 8% of time is taken up by the GC, and 30% of time is spent in the logging code calling Time.new!
Armed with that information we now know where the bottlenecks are, their associated codepaths, and we can now work on optimizing our application! In similar fashion, Aman produced visualizations for rubygems, Merb, Rails, and EventMachine - tons of insights in each graph! Definitely a nice library to add to your debug and performance optimization toolkit!
 Ilya Grigorik is a web ecosystem engineer, author of High Performance Browser Networking (O'Reilly), and Principal Engineer at Shopify — follow on Twitter.