Building a Faster Web
Make The Web Fast (MTWF)
Make the entire web faster
- Kernel, Networking, Mobile, Chrome, Infrastructure, ...
- Research & drive performance web standards (W3C, etc)
- Build open source tools, contribute to existing projects
- Optimize Google, optimize the web...
Usability Engineering 101
| Delay | User reaction |
|---|---|
| 0-100ms | Instant |
| 0-300ms | Feels sluggish |
| 100-1000ms | Machine is working... |
| 1s+ | Mental context switch |
| 10s+ | I'll come back later... |
Usability Engineering - Jakob Nielsen, 1993
- SLOW
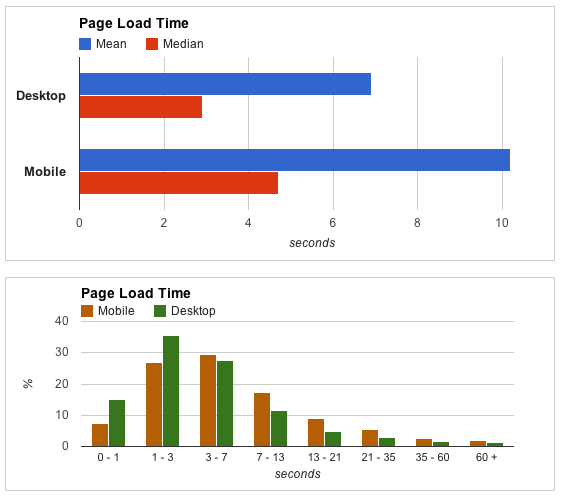
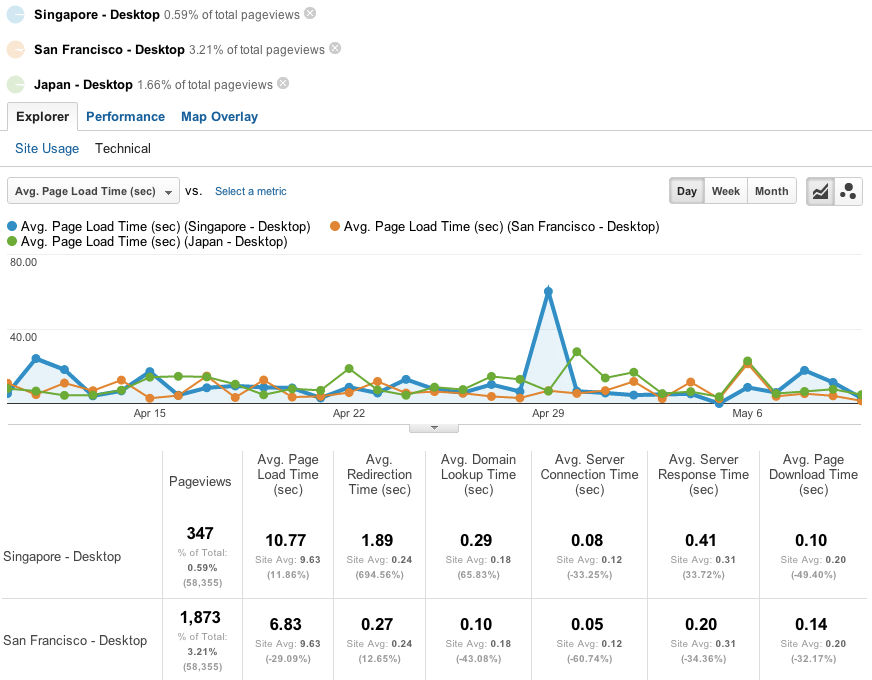
How Fast Are Websites Around The World? - Google Analytics Blog (April, 2012)
Let's look at our neighbors...
| Mean (s) | Median (s) | |
|---|---|---|
| Japan | 5.9 | 3.5 |
| Singapore | 12.0 | 5.9 |
| China | 12.0 | 5.6 |
| Indonesia | 12.4 | 5.6 |
| Malaysia | 13.2 | 6.2 |
| Thailand | 16.3 | 5.9 |
| India | 16.3 | 7.4 |
How Fast Are Websites Around The World? - Google Analytics Blog (April, 2012)


Me, last Friday, reading the news...
Fin. Questions?
- user's connectivity
- server
- browser execution
- user's perceived page load time!
If only it were that simple...
Bandwidth will not save us!
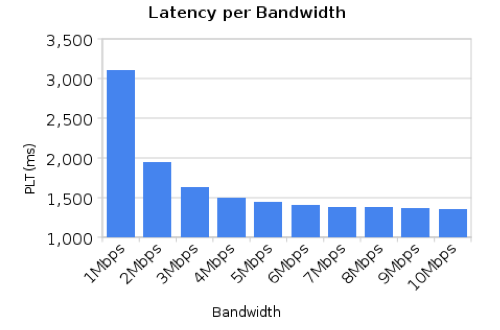
Modest to no noticeable speedup after 5mbps! Errrrr.. why!?
| Content Type | Avg # of Requests | Avg size |
|---|---|---|
| HTML | 8 | 44kB |
| Images | 53 | 635kB |
| Javascript | 14 | 189kB |
| CSS | 5 | 35kB |
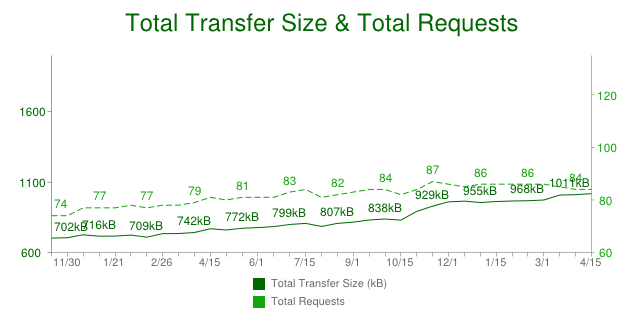
HTTP Archive - Trends (April, 2012)
HTTP Archive - Trends (April, 2012)
- TCP connections are expensive
- TCP connections "start slow" - see TCP slow-start
- Most TCP connections don't reach their bandwidth limit
84 requests on average...
- HTTP was designed to fetch large pages
- HTTP has big framing overhead: headers, cookies, etc
- HTTP does not compress headers
- HTTP cannot multiplex requests
HTTP 1.1 - vintage 1999

- Session layer protocol (SSL + NPN)
- Enhancement to HTTP, not a replacement
- Multiplexing, header compression, priorities, security
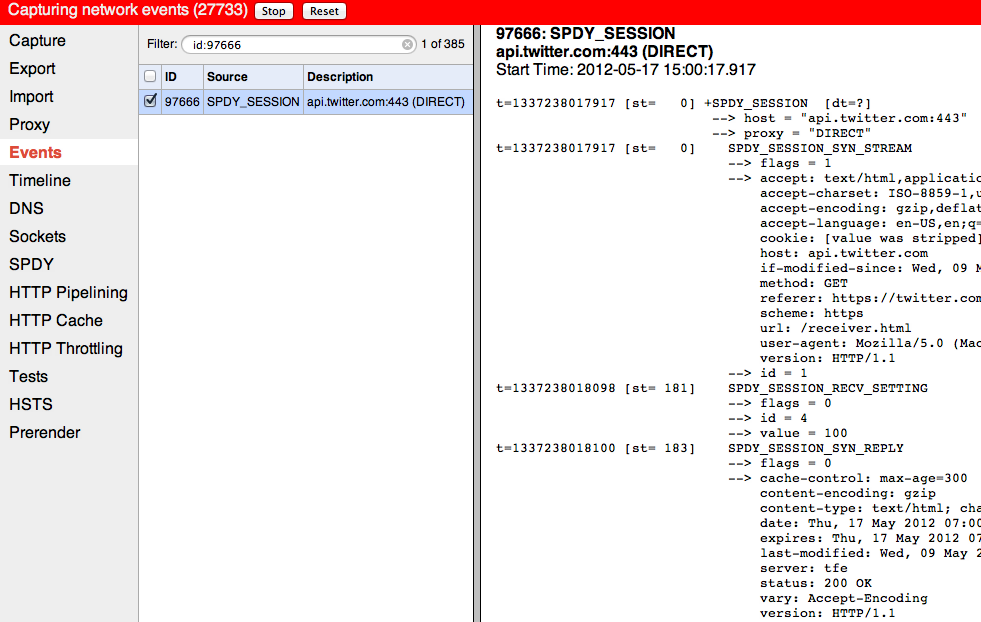
SPDY (SPeeDY)
SPDY IETF proposal, part of HTTPbis 2.0 working group
chrome://net-internals/#spdy
(faster) connectivity won't save us, better protocols can help, but...
we need you to build faster pages
(short) life of a web request...
- Unload the DOM
- DNS resolution
- Connection & TCP handshake
- Send request, wait for response
- Parse response
- Request sub-resources (see step 1)
- Execute scripts, apply CSS rules
TODO: optimize 5 through 7, rinse, lather, repeat.
How did the user see it?
Created via webpagetest.org: IE 8, from Tokyo... Yikes?
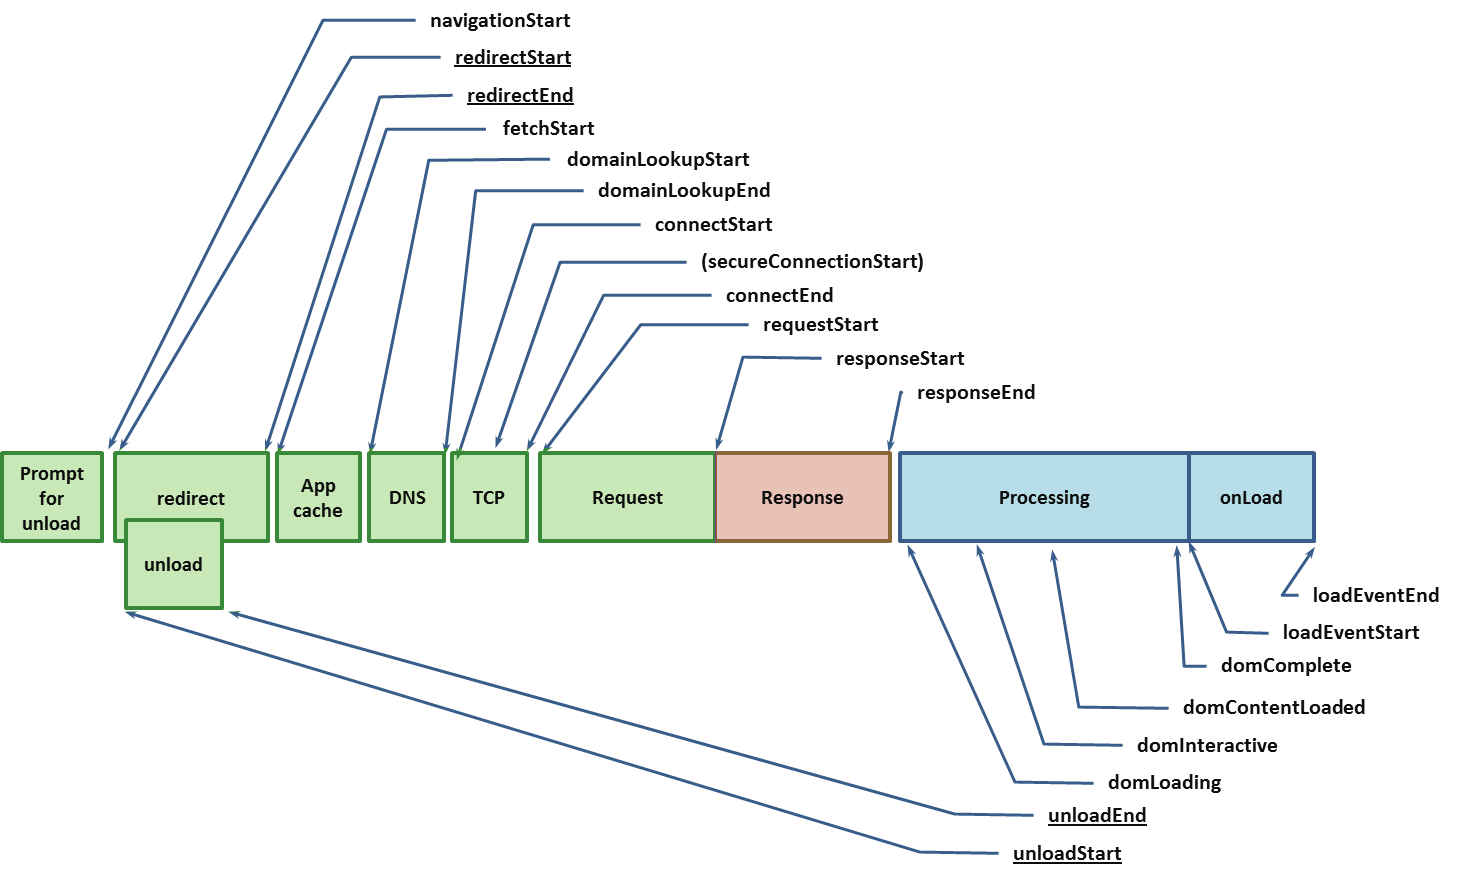
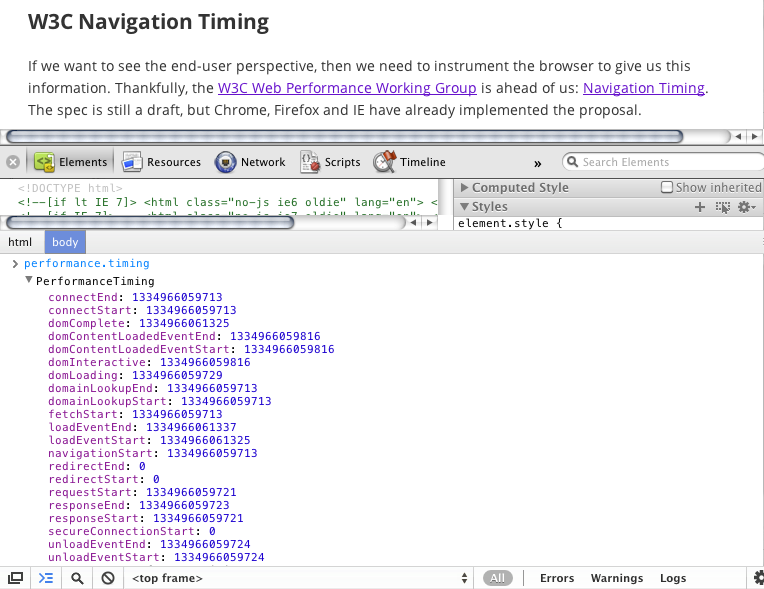
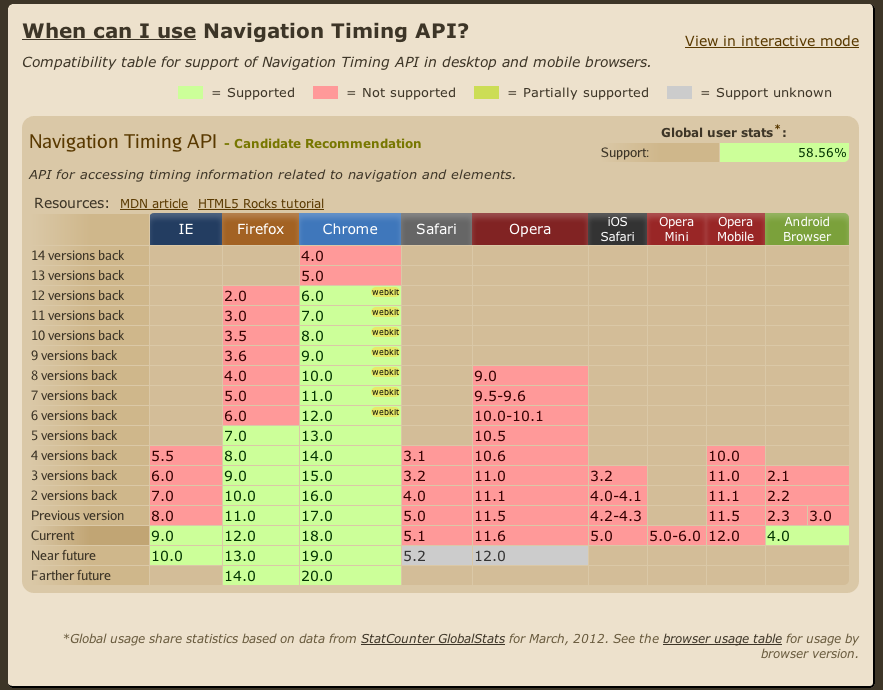
Navigation Timing (W3C)
<script>
  _gaq.push(['_setAccount','UA-XXXX-X']);
  _gaq.push(['_setSiteSpeedSampleRate', 100]); // #protip
  _gaq.push(['_trackPageview']);
</script>
- Defaults to 5% sampling rate
- Max sample is 10k visits/day
- GA advanced segments FTW!
Google Analytics > Content > Site Speed
setSiteSpeedSampleRate docs / Yahoo's Boomerang
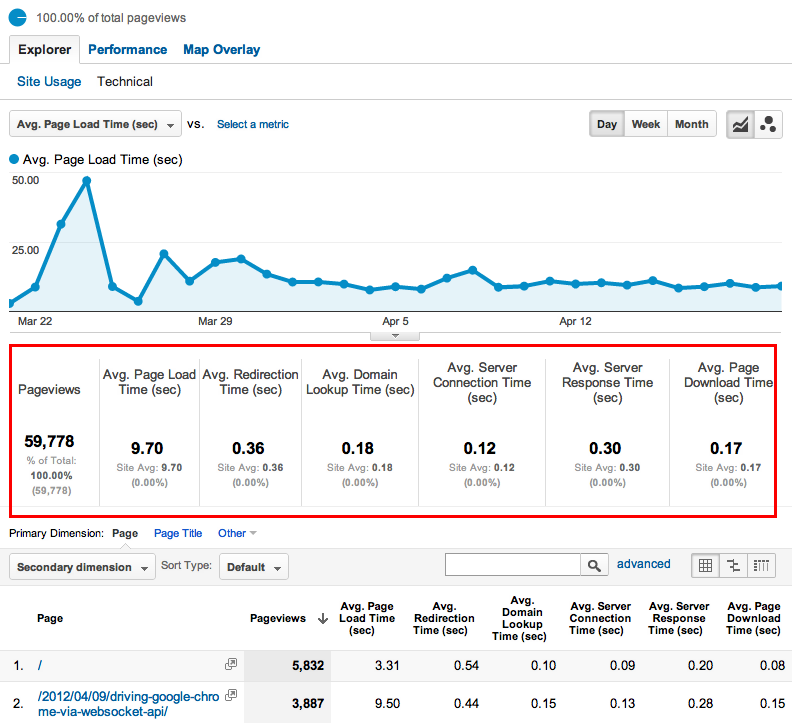
No instrumentation
required
required
Segment by:
geo, browser, UA, ...
geo, browser, UA, ...
Averages (often) lie!

Skeweness - Wikipedia
Place your...

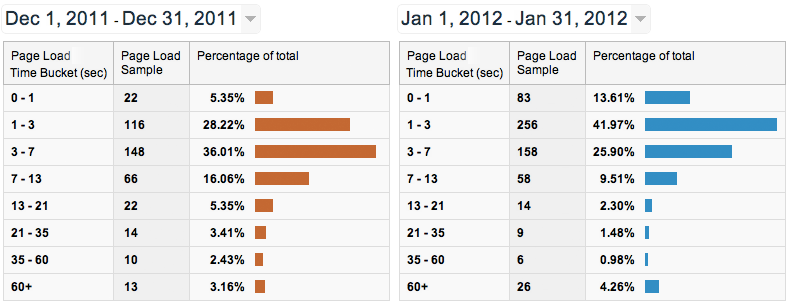
Case Study: igvita.com Page Load Time
Content > Site Speed > Page Timings > Performance
Migrated site to new host, server stack, web layout, and using static generation. Result: noticeable shift in the user page load time distribution.
Measuring Site Speed with Navigation Timing - igvita.com
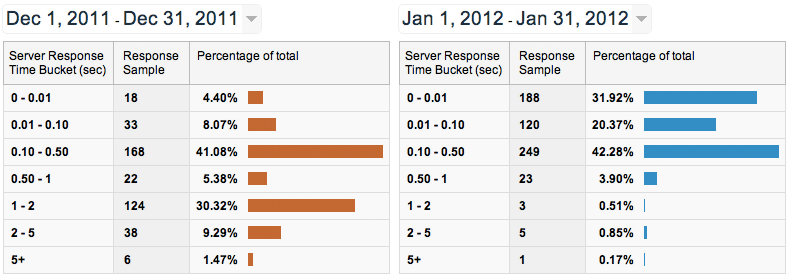
Case Study: igvita.com Server Response Time
Content > Site Speed > Page Timings > Performance
Bimodal response time distribution?
Theory: user cache vs. database cache vs. full recompute
Measuring Site Speed with Navigation Timing - igvita.com
(ab) using GA "user timings" reports
- "method to track periods of time in Google Analytics"
- AJAX calls, timer intervals, user interactions
<script>
  _gaq.push(['_trackTiming', 'category', 'label', time]);

  _gaq.push(['_trackTiming', 'jQuery', 'Load library', 20]);
  _gaq.push(['_trackTiming', 'slide', slideNum, timeOnSlide]);
  //                                            ^^^ win.
</script>
ResourceTiming interface to allow Javascript mechanisms to collect complete timing information related to resources on a document.
W3C draft / work in progress
ResourceTiming draft, follow webkit status
Measure, analyze, optimize, repeat...
- Measure user perceived latency
- Use Navigation Timing data
- Use GA's advanced segments!
- Setup {daily,weekly, ...} reports
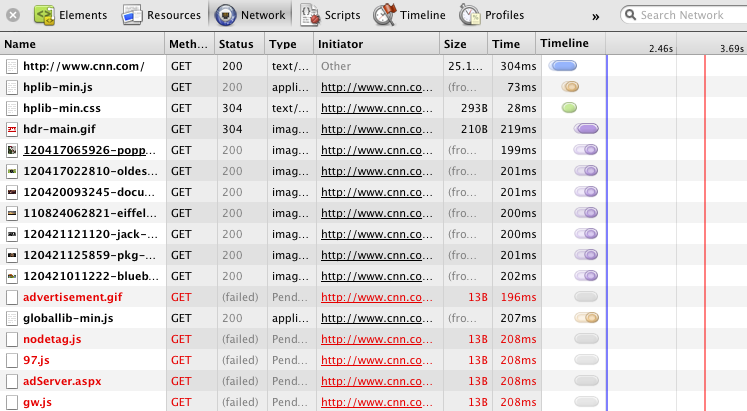
cnn.com waterfall: blocking JS requests, missing assets, missing cache headers on images and JS. Plenty of room for improvement.
Question: what are the blue and red lines in the waterfall?
- DOMContentLoaded fires when parsing is complete
- onload fires when all resources loaded (spinner stops)
Place your...
- CSS at the top
- JavaScript at the bottom
DOMContentLoaded vs. onload
DOMContentLoaded test drive
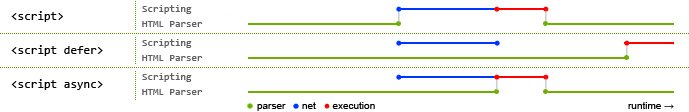
<script src="file-a.js"></script>
<script src="file-b.js" defer></script>
<script src="file-c.js" async></script>
async vs. defer - what's the difference?
<script src="file-a.js"></script>
<script src="file-b.js" defer></script>
<script src="file-c.js" async></script>
- regular: wait for network, execute, proceed
- defer: download in background, execute in order after onload
- async: download in background, execute when ready
async vs. defer
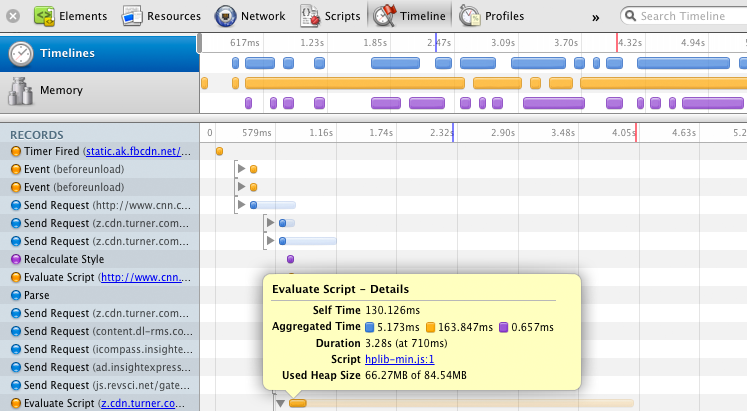
cnn.com timeline: evaluate every request, track JS execution time, style reflows, etc.
60%+ of the weight of the page is images (on average)
Images * 53
Portable "Network" Graphics (PNG) != always PNG
- Regular PNG from photoshop
- "Crushed" PNG
- JPEG at 100%
- JPEG at 85%
- Navigation Timing API for user latency
- Google Analytics + Site Speed
- Unblock onload!
- Optimize your images
- Use Chrome Dev Tools: Network, Profiler, ...
Measure twice before you optimize
- PageSpeed Insights
- PageSpeed Insights + browser plugins (Chrome, FF)
- mod_pagespeed
 Google PageSpeed
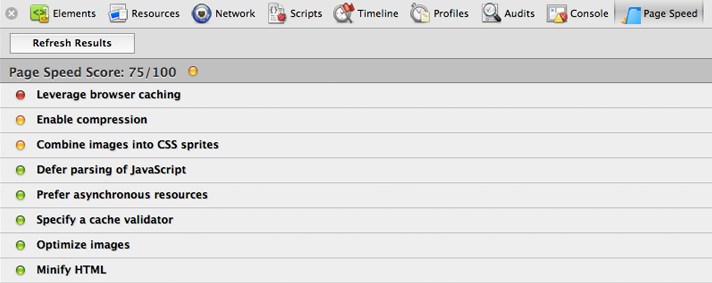
PageSpeed Insights

- 0-100 score (the higher, the better)
- Desktop + Mobile optimized analysis & recommendations
- 31+ optimization rules (and growing)
- Demo: cnn.com
PageSpeed Browser Plugins
- Browser integration for Chrome & Firefox
- Open-source SDK for embedding (same rules, same code)
- Active pagespeed community
- Your page won't reach 100 (unless it's blank)
- Every resource on your page has a cost
- You shold know the cost of each resource
- Not everything should be cached for N years
Goal: no surprises in the recommendations.
But PageSpeed Insights tells me to...

mod_pagespeed
Open-source Apache module that automatically optimizes web pages and associated resources.
ModPagespeedCssInlineMaxBytes                2048
ModPagespeedImageInlineMaxBytes              2048
ModPagespeedCssImageInlineMaxBytes           2048
ModPagespeedJsInlineMaxBytes                 2048
ModPagespeedCssOutlineMinBytes               3000
ModPagespeedJsOutlineMinBytes                3000
ModPagespeedRetainComments                   "[WILDCARD PATTERN]"
ModPagespeedJpegRecompressionQuality           -1
ModPagespeedImageLimitOptimizedPercent        100
ModPagespeedImageLimitResizeAreaPercent       100
ModPagespeedMaxInlinedPreviewImagesIndex        5
ModPagespeedMinImageSizeLowResolutionBytes  10240
// ...
mod_pagespeed + Passenger = fast(er) Rails
<VirtualHost *:80>
    ServerName www.awesome-rails-app.com
    DocumentRoot /apps/foo/public

    PassengerEnabled on
    ModPagespeed on

    /* ... */
</VirtualHost>
- Dozen's of automatic filters (and growing)
- Like asset pipeline, but much more...
- Inlining, optimization, resizing, headers, UA patterns, etc.
- Half the battle is knowing what to to measure
- Measure user perceived latency
- Optimize from user's perspective
- Mobile web is 1.5x slower on average!
- No excuses, the tools are there *
- Plenty of better tools to be built still
- Automate what you can - tip: mod_pagespeed :-)
Food for thought...
+Ilya Grigorik, @igrigorik, igrigorik@google.com
Blog @ www.igvita.com