Skeweness - Wikipedia
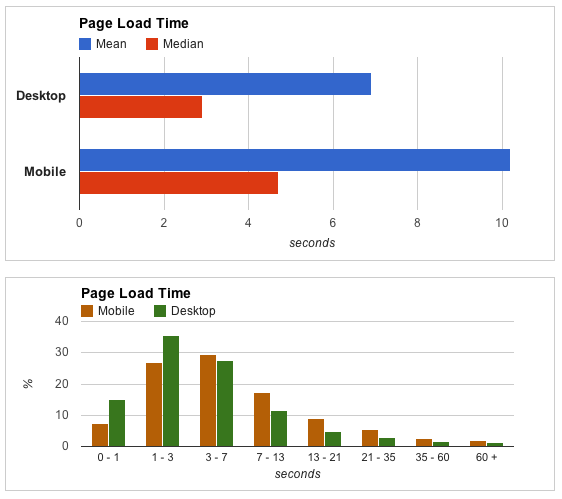
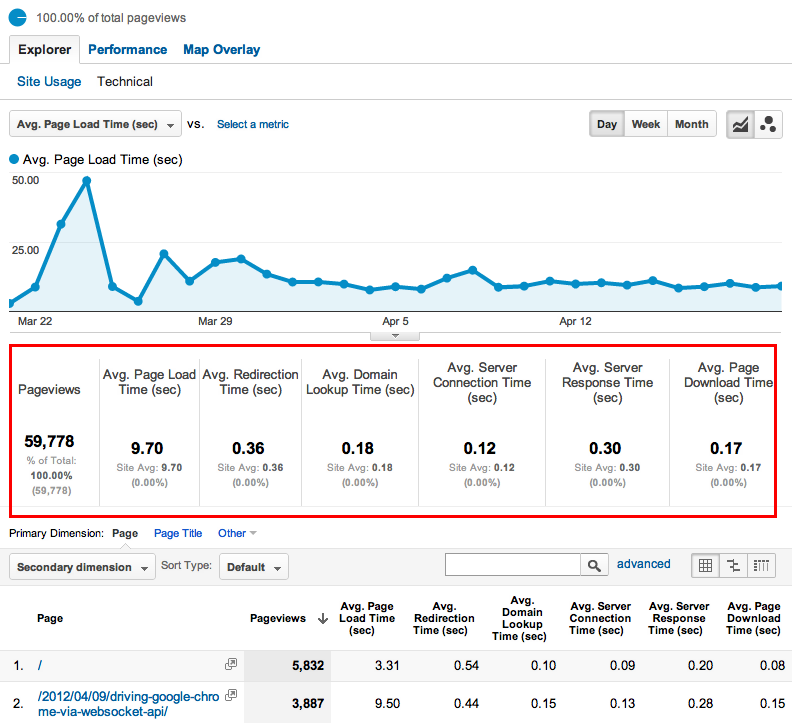
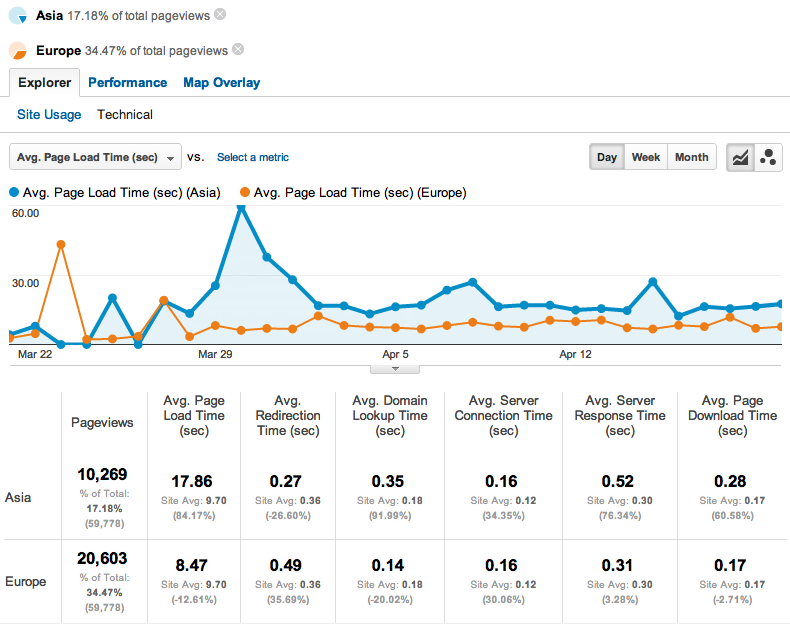
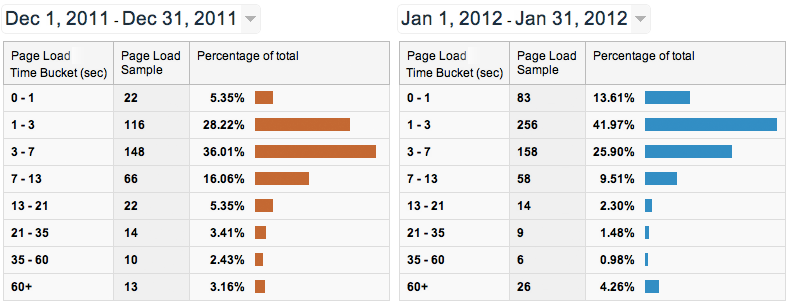
Case Study: igvita.com Page Load Time
Content > Site Speed > Page Timings > Performance
Migrated site to new host, server stack, web layout, and using static generation. Result: noticeable shift in the user page load time distribution.
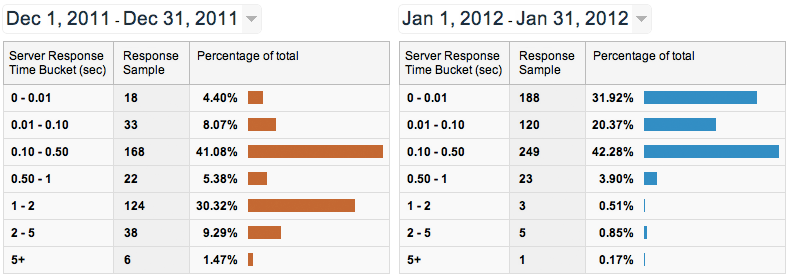
Case Study: igvita.com Server Response Time
Content > Site Speed > Page Timings > Performance
Bimodal response time distribution?Theory: user cache vs. database cache vs. full recompute
Measure, analyze, optimize, repeat...
Measure user perceived latency
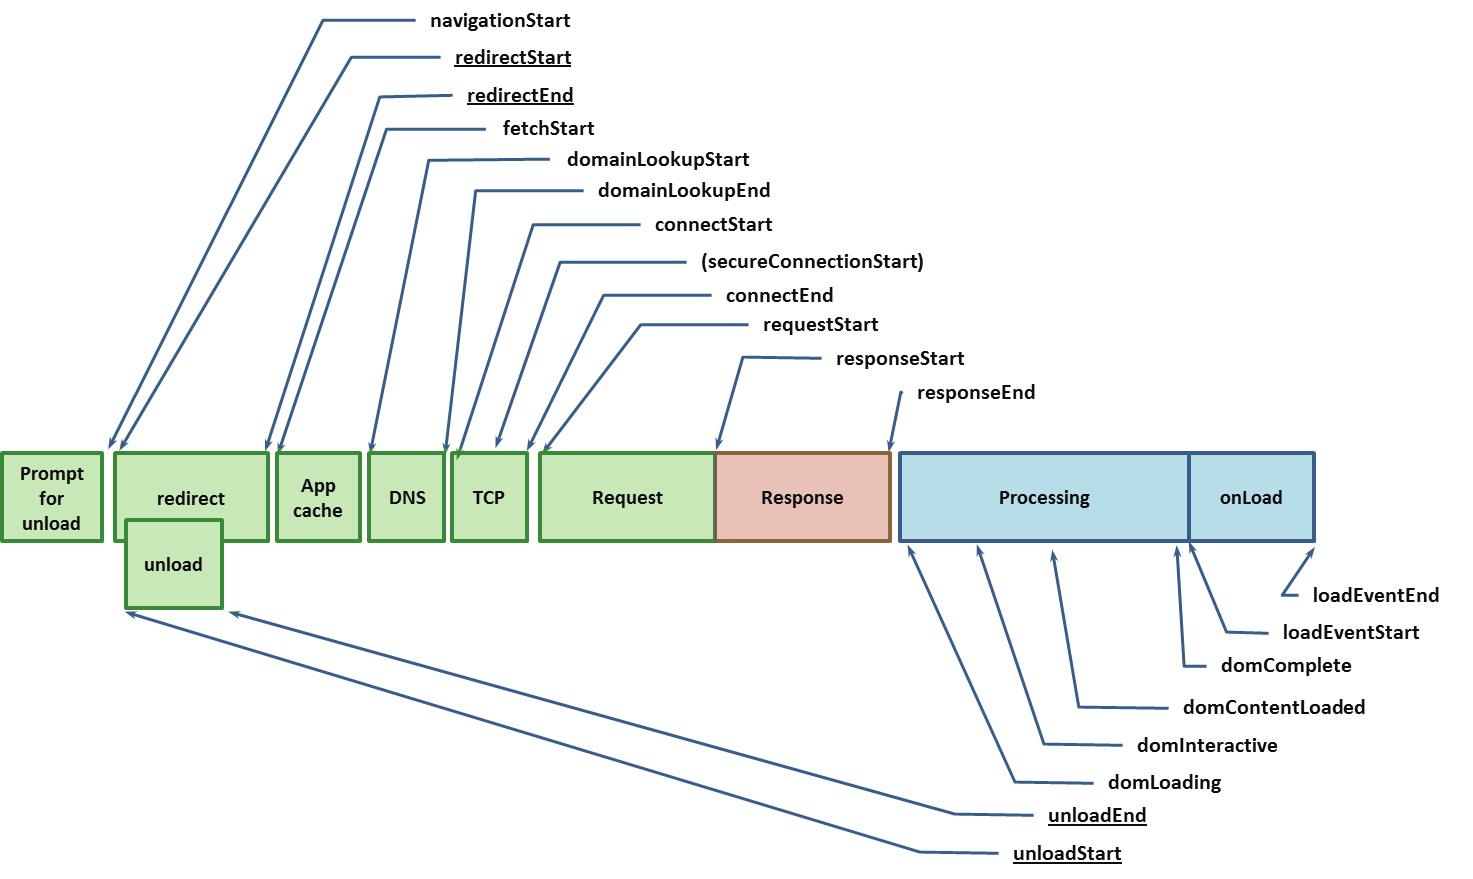
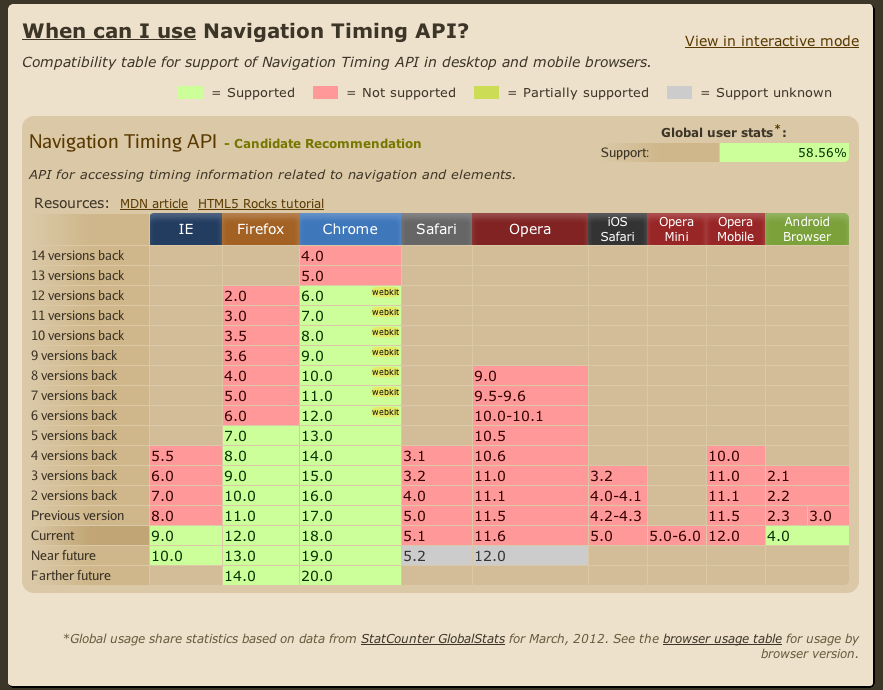
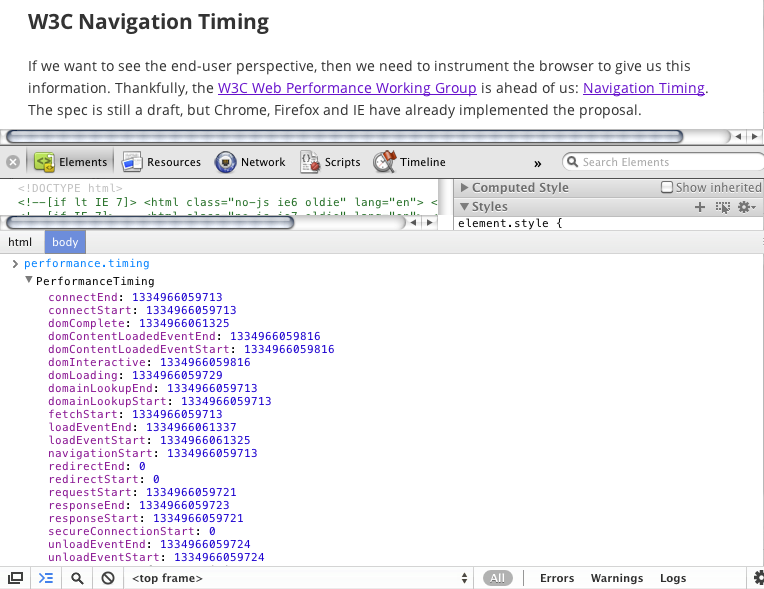
Use Navigation Timing data
Use GA's advanced segments!
Setup {daily,weekly, ...} reports
Chrome Developer Tools
Level 1: Network waterfall
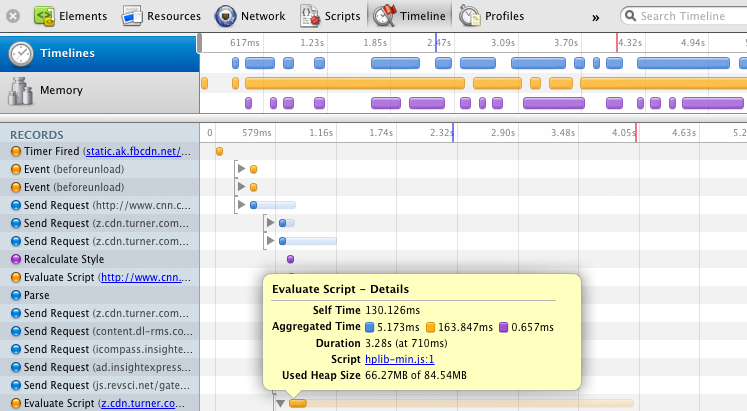
Level 2: Timeline profiler
Level 3: CSS/JS profiler
Level o_O: chrome://tracing
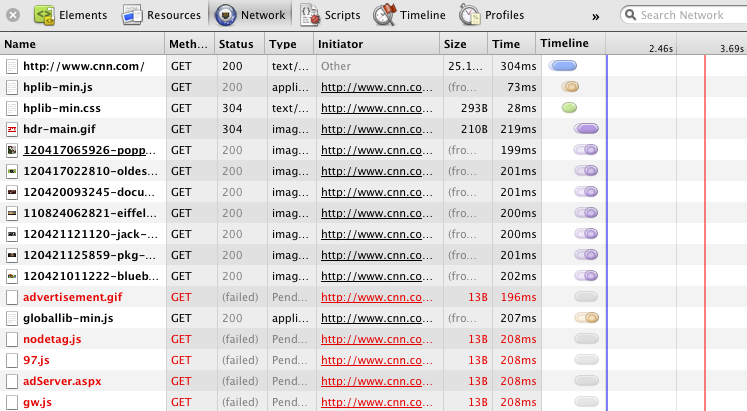
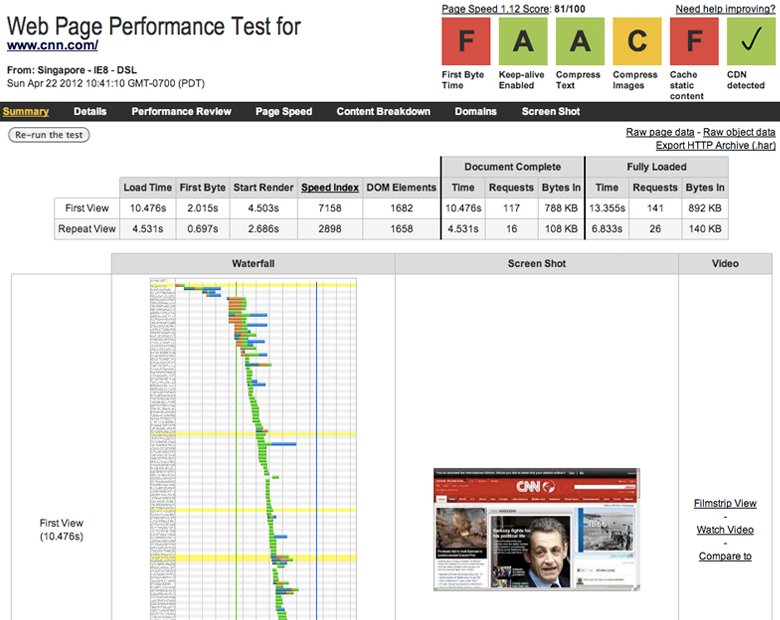
Hands-on: Analyzing Performance
cnn.com waterfall : blocking JS requests, missing assets, missing cache headers on images and JS. Plenty of room for improvement.
cnn.com timeline : evaluate every request, track JS execution time, style reflows, etc.
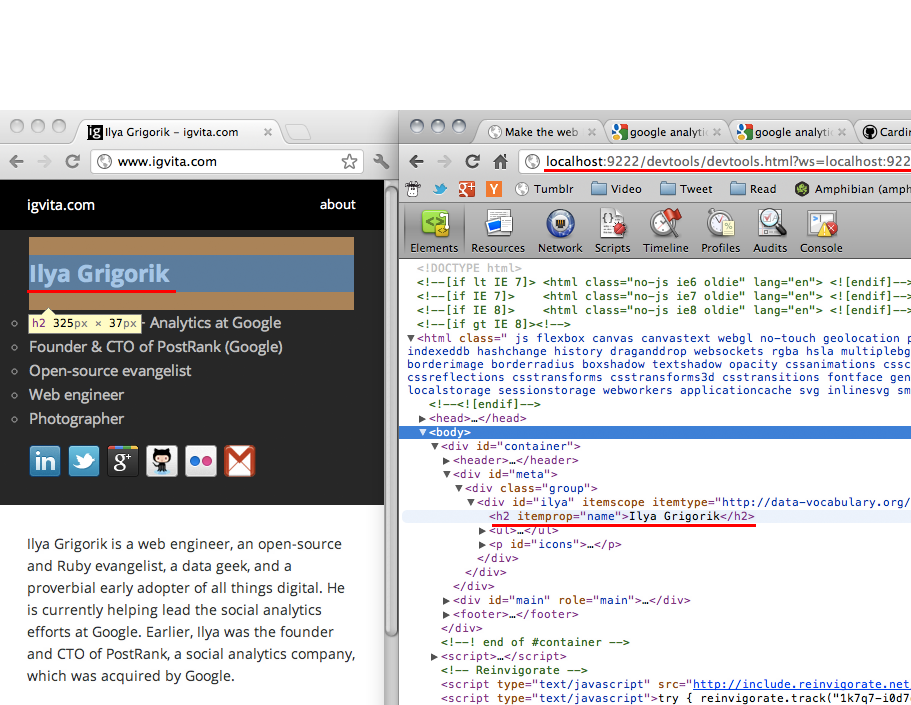
Chrome DevTools is a web app!
<meta>
No magic, pure HTML fun
Remote debugging.. via Chrome!
</meta>
Remote Debugging + Performance Analysis
$> Google Chrome --remote-debugging-port=9222
$> curl localhost:9222/json
[ {
   "devtoolsFrontendUrl": "/devtools/devtools.html?host=localhost:9222&page=1",
   "faviconUrl": "",
   "thumbnailUrl": "/thumb/chrome://newtab/",
   "title": "New Tab",
   "url": "chrome://newtab/",
   "webSocketDebuggerUrl": "ws://localhost:9222/devtools/page/1"
} ]
Each open tab is a process
Each process has a ws:// debug URL
Remote DOM + Debugging FTW!
Driving Chrome from CLI
ws = Faye::WebSocket::Client.new(resp.first['webSocketDebuggerUrl'])
ws.onopen = lambda do |event|
  ws.send JSON.dump({id: 1, method: 'Network.enable'})

  ws.send JSON.dump({
    id: 2,
    method: 'Page.navigate',
    params: {url: 'http://twitter.com/#!/search/chrome?q=railsconf&' + rand(100).to_s}
  })
end

ws.onmessage = lambda do |event|
  p [:new_message, JSON.parse(event.data)]
end
responseReceived event
"method":"Network.responseReceived",
"params":{
  "type":"XHR",
  "response":{
     "url":"http://api.twitter.com/1/trends/available.json?lang=en",
     "status":200,
     "statusText":"OK",
     "mimeType":"application/json",
     "connectionReused":false,
     "fromDiskCache":false,
     "timing":{
        "requestTime":1333830921.9814498,
        "connectStart":1,
        "receiveHeadersEnd":234
        // ...
Instrument all the things!
Chrome for Android : same tools + all the same stats!
In-browser stats: network, DOM, JS, GPU, memory
Remote instrumentation: debugging, perf analysis, DOM manipulation, ...
TL;DR : You have no excuse.. all the tools are there!
Wonder how my page load time looks in IE {8,9,10} for a visitor from Singapore...
You after this talk...
WebPagetest.org
Developed at AOL, open-sourced in 2008
Actively developed and maintained
Test sites across the globe
Test with various browsers, connection speeds, geo locations. Support for video capture, waterfall analysis, page speed optimization checks, and much more -- all, for free .
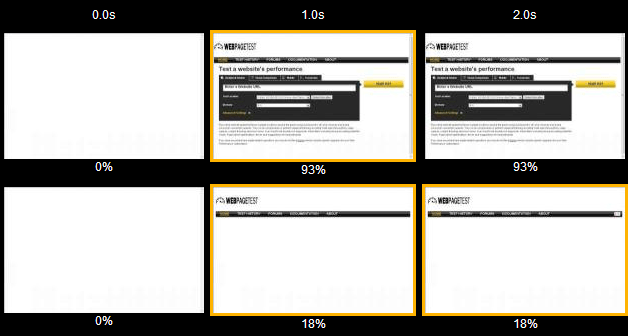
How did the user see it?
On-demand video + filmstrip view, tcpdump stats, HAR downloads, and more.
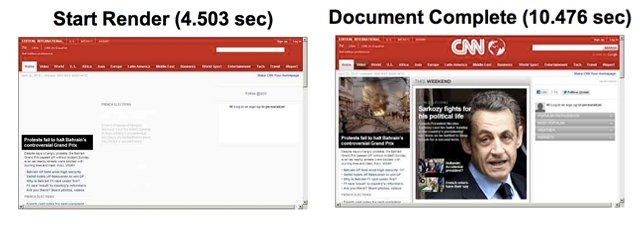
Measuring "visual completeness"?
measures how quickly the page contents are visually populated
Introducing "Speed Index"
Speed Index: Step 1
Render filmstrip of optimized page
Render filmstrip of original page
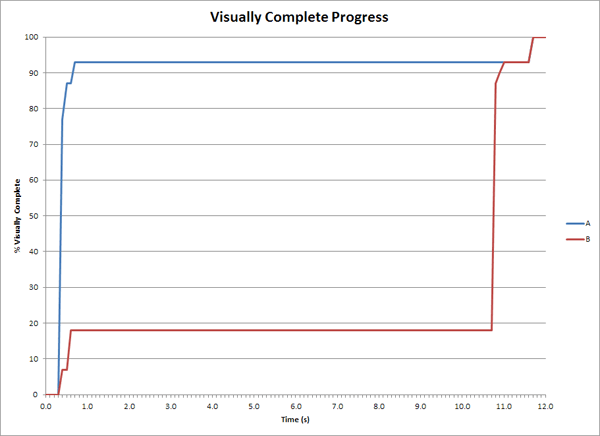
Speed Index: Step 2
Plot "visual completeness" vs. time
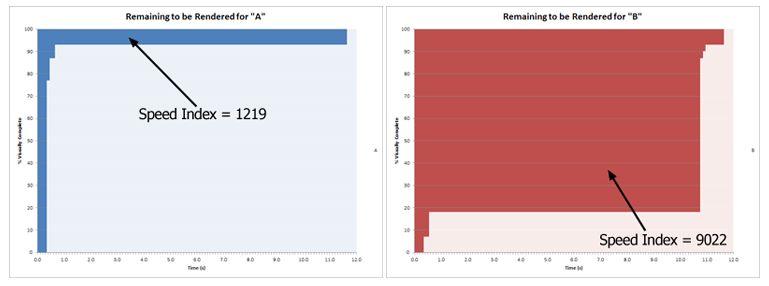
Speed Index: Step 3
Use "area above the graph" to calculate unrendered portion of the page
Color histogram: not perfect, but good tradeoff so far
Lower score means faster visual rendering
Web Timing API for user latency
Google Analytics + Site Speed
Chrome Dev Tools: Network, Profiler, ...
Remote profiling: Mobile, CLI, ...
WebPageTest.org: Geo + Browser testing
Speed Index: Visual completeness
Measure three times before you...
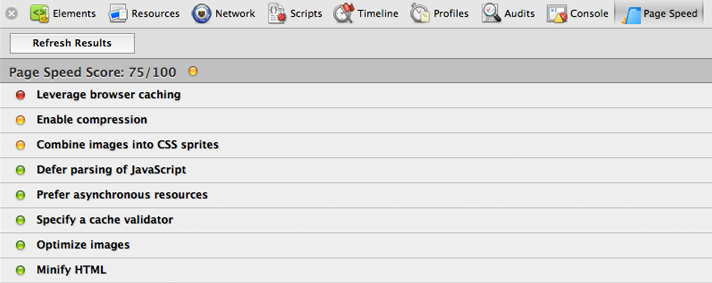
PageSpeed Online
PageSpeed SDK
mod_pagespeed
PageSpeed Service
PageSpeed Online
PageSpeed Online API
require 'net/https'
require 'json'

uri  = URI.parse('https://www.googleapis.com/pagespeedonline/v1/runPagespeed')
http = Net::HTTP.new(uri.host, uri.port)
http.use_ssl = true

params = { :key => 'API KEY', :url => 'http://railsconf2012.com/',
           :strategy => 'desktop', :rules => '...' }

uri.query = URI.encode_www_form(params)
req = Net::HTTP::Get.new(uri.request_uri)
res = http.request(req)

jj JSON.parse(res.body)
API Documentation , widget examples, etc.
PageSpeed SDK
mod_pagespeed
Open-source Apache module that automatically optimizes web pages and associated resources.
ModPagespeedCssInlineMaxBytes                2048
ModPagespeedImageInlineMaxBytes              2048
ModPagespeedCssImageInlineMaxBytes           2048
ModPagespeedJsInlineMaxBytes                 2048
ModPagespeedCssOutlineMinBytes               3000
ModPagespeedJsOutlineMinBytes                3000
ModPagespeedRetainComments                   "[WILDCARD PATTERN]"
ModPagespeedJpegRecompressionQuality           -1
ModPagespeedImageLimitOptimizedPercent        100
ModPagespeedImageLimitResizeAreaPercent       100
ModPagespeedMaxInlinedPreviewImagesIndex        5
ModPagespeedMinImageSizeLowResolutionBytes  10240
// ...
mod_pagespeed + Passenger = fast(er) Rails
<VirtualHost *:80>
    ServerName www.awesome-rails-app.com
    DocumentRoot /apps/foo/public

    PassengerEnabled on
    ModPagespeed on

    /* ... */
</VirtualHost>
Dozen's of filters (and growing)
Like asset pipeline, but much more...
Inlining, optimization, resizing, headers, UA patterns, etc.
PageSpeed Service fetches content from your servers, rewrites the pages by applying web performance best practices and serves them to end users via Google's servers across the globe.
Setup:
Alias DNS CNAME entry to ghs.google.com.
Sit back and enjoy
Stay tuned for more...
PageSpeed Service (beta)
Mobile optimizations
Javascript & CSS optimizations
Image compression & WebP
TCP, SSL & kernel optimizations
SPDY
...
Wait, there is more (but no time)...
Half the battle is knowing what to to measure
Measure user perceived latency
Optimize from user's perspective
Mobile web is 1.5x slower on average!
No excuses, the tools are there *
Plenty of better tools to be built still
Food for thought...
+Ilya Grigorik , @igrigorik , igrigorik@google.com
Blog @ www.igvita.com
Slides: bit.ly/faster-rails bit.ly/faster-rails-video
Fin. Questions?


 Google PageSpeed