Web Performance Anomaly Detection with Google Analytics
 Step one, monitor all the things. Step two, dedicate 90% of your analytics time and resources to analyzing data, deriving insights, and iterating on what metrics are being monitored and are being optimized. However, there is one small problem. Chances are, the amount of data produced by the instrumentation outpaces your ability to analyze, monitor, and correlate all the variations of the variables at play.
This is where an anomaly detection algorithm, backed by a good statistical engine with access to the data can prove invaluable: it does not need to be perfect, but it should be able to alert you to significant outliers in the data. With the alert in hand, or in your mailbox, you can dig in and determine if more investigation is required.
Google Analytics Intelligence Events
Good news, if you are using Google Analytics, then you already have a powerful anomaly detection engine at your disposal: Intelligence Events. Best of all, it can leverage all of your existing data, configured segments, and other customizations. And the price is right as well - it's free.
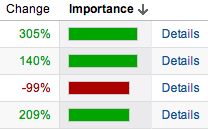
Analytics monitors your website's traffic to detect significant statistical variations, and then automatically generates alerts, or Intelligence Events, when those variations occur. Taking a closer look at these anomalies can provide insights you might have otherwise missed, for example, a spike in traffic from a particular city or referring site.
In fact, with a little bit of work and customization, Intelligence Events can be easily configured to help you monitor the performance of your site! Visitors from India seeing a sudden spike in page load times? Now you have an automated tool which will help you spot the problem.
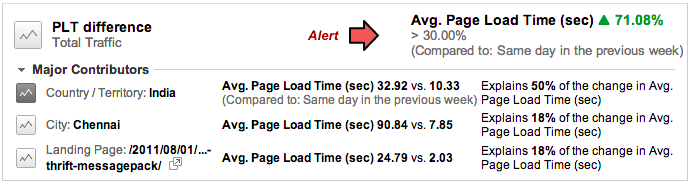
Even better, the sample report above correlated the likely contributors to the generated alert and identified visitors from Chennai, India as experiencing a significant increase in their page loading times. With this information in hand, you can dig deeper to identify root cause.
Web performance anomaly detection
Google Analytics samples page load time performance data for browsers that support the W3C Navigation Timing API's, which includes: redirect and DNS times, TCP establishment, server response times, as well as DOM-level metrics such as the onload time. There are over half a dozen metrics in total, each recorded from a real user accessing your site - in other words, this is Real User Measurement (RUM), not synthetic data.
If you're not familiar with the Site Speed reports, then that's a good place to start - check out this GDL episode for an in-depth look. However, we're going to go a level deeper: each of the Navigation Timing metrics can be monitored with Intelligence Events! All you need to do is create a custom alert and define a few threshold criteria which will trigger it in the future.
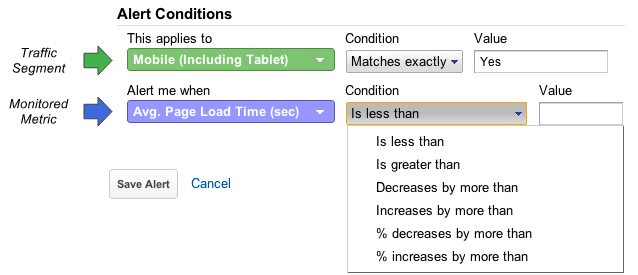
A few performance alert ideas for your site:
- Track DNS resolve times across the world, or in specific regions
- Track server response times across all visitors, or customize for different versions of the site
- Track onload time to detect misbehaving CSS, scripts, and other resources
Powertip: Use Advanced Segments!
Setting up an alert for a specific variable, within a global context, is a good place to start. However, if you have not created a custom advanced segment in Google Analytics, then you've only scratched the surface of what's possible. Need to monitor the page load time (PLT), or DNS times for all mobile visitors in Asia, or perhaps Tokyo specifically? No problem, just create a new custom segment:
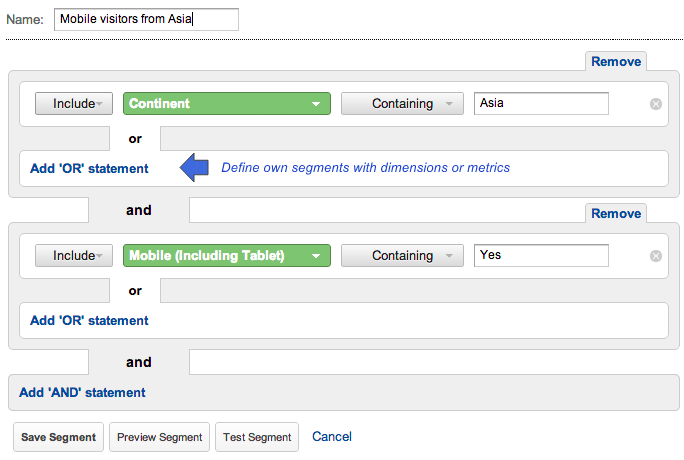
You can apply the segment on any report in Google Analytics, and once created, you can also select it when setting up the Intelligence Alert! If there are specific markets, or types of users or traffic that you're concerned about, then creating an advanced segment will allow you to tailor the alerts as well.
Measure, Optimize, Iterate
Anomaly detection is a tool, and a powerful one at that. However, it is still up to you to define, and iteratively improve the segments and the thresholds to tailor the alerts to your application. Expect false positives, but also expect to be alerted to issues that you would never otherwise have caught in the torrent of the monitoring data.
 Ilya Grigorik is a web ecosystem engineer, author of High Performance Browser Networking (O'Reilly), and Principal Engineer at Shopify — follow on Twitter.