Web Performance Power Tool: HTTP Archive (HAR)
 When it comes to analyzing page performance, the network waterfall tab of your favorite HTTP monitoring tool (e.g. Chrome Dev Tools, Firebug, Fiddler, etc) is arguably the single most useful power tool at our disposal. Now, wouldn't it be nice if we could export the waterfall for better bug reports, performance monitoring, or later in-depth analysis?
Well, good news, that is precisely what the HTTP Archive (HAR) data format was created for. Even better, chances are, you favorite monitoring tool already knows how to speak in HAR, which opens up a lot of possibilities - let's explore.
The "HAR Show" on GDL
The best part about working with HAR data is the number of free tools available to analyze it, visualize it, and even trend it overtime. To highlight some of these applications, Peter Lubbers and myself recorded a GDL episode of nothing but awesome demos. Tune in above to check them out, or (and) continue reading for some highlights.
HAR 101: The data format
A HAR file is encoded with a simple JSON format, which is both easily created and consumed. Each HAR file contains a list of loaded pages, and a list of entries for each requested resource for each page - see example. In turn, each resource stores the start time of the request, the request method, all the headers, cookies, and payload size. Similarly, the response object contains all the associated response data, including response timing data such as timestamps for DNS, SSL handshakes, TCP connect, and wait times, amongst others.
 In other words, the HAR file contains all the meta-data that you need to create the network waterfall. The only notable omission is the response body itself - by default, most tools will only store the meta-data.
But, enough theory, how do we get a HAR file? Simple, in Chrome, open the Network tab in Dev Tools, right click on the waterfall, and there you have it: Save All as HAR. Note that you can also export an individual request, or simply copy the JSON data into clipboard.
Analyzing HAR archives
Great, we can export the network waterfall in HAR format, now what? Well, to start, you can save it for later analysis, or attach it to a bug report - sure beats annotating screenshots of the timeline. But you can also feed the data into HAR Viewer, to get an interactive timeline directly in your browser:
HAR viewer is a free and open-source (PHP + JavaScript) application, which you can host yourself, or use the hosted version: paste the HAR data you copied earlier, and you can view the timeline. Alternatively, if you need a quick way to visualize a local HAR file, then the har Ruby gem is indispensable:
$> gem install har
$> har /path/to/waterfall.har

    Merging HARs...done.
    Creating viewer...done.
    Starting server...
    [2012-08-26 10:18:55] INFO  WEBrick 1.3.1
The gem will start a local server and automatically open a browser tab to view the HAR Viewer waterfall - handy.
Performance Optimization & Trending
The great thing about being able to export detailed network data for any page is that it enables us to automate the process, capture long-term trends, and identify regressions and anomalies. Let's use PhantomJS, which is a headless WebKit browser with full JavaScript support, to capture the network waterfall directly from the CLI:
# download, and unpack PhantomJS: http://phantomjs.org/download.html
$> phantomjs examples/netsniff.js http://www.igvita.com/ > igvita.har
$> npm install yslow -g
$> yslow --info basic --format plain igvita.har
size: 67.0K (67000 bytes)
overall score: A (94)
url: http://www.igvita.com/
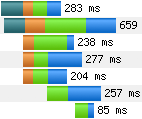
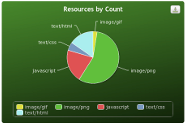
# of requests: 9
ruleset: ydefault
page load time: 821
$> yslow --info all --format json igvita.har
...Once we have the HAR file, we also feed it to YSlow to score the run and build a short report. Alternatively, YSlow can also provide a full JSON, or XML analysis with respect to all of the built-in rules. If you're a PageSpeed fan, then you can also download and build the SDK, which will give you a har_to_pagespeed binary for similar analysis.
 With that, you can now add an extra step to your CI build to capture the network waterfall, sanity check it for regressions, and fire the alarms accordingly. Now, how about some trends or historical analysis? We can do that too, with the help of another free and open-source tool: HAR Storage. Powered by Pylons and MongoDB under the hood, it allows us to log the measurements, compare them side by side, run aggregate analysis, and much more. Try the demo version at harstorage.com.
An open source performance suite in three easy steps: capture HAR with PhantomJS, analyze with YSlow for anomalies, automatically export to HAR Storage for the trends.
Advanced Recipes: PCAP & Server Traces
The browser is a convenient way to capture and export HAR's, but it's also not the only way. As long as you can configure your client app to use a proxy, such as Charles Proxy (Mac) or Fiddler (Windows), then you can export the same data. But, what if you don't control the client, or there is no easy way to force a proxy? Most mobile phones fall into this category. Wouldn't it be nice if we could log, visualize and analyze the data for these devices also?
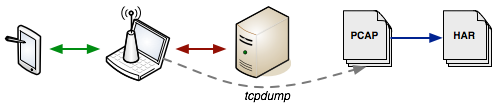
Well, here's the trick: run a WiFi hotspot from your computer, connect to it via your mobile phone, and capture the TCP traffic flow with your favorite tool (tcpdump, Wireshark, or similar). With the pcap file in hand, we can now convert it to a HAR file with pcap2har, or visualize it directly in HAR Viewer with pcapperf!
Finally, why limit HAR data for web browsing? After all, many server applications follow the same pattern: request comes in, we dispatch requests to databases or other services, aggregate, return response. In the process, nothing stops from creating a simple, HAR formatted, server execution trace. In fact, here is a trivial example:
A request came in for the latest RSS feed, which triggered a search request for a list of latest articles, and then a parallel fetch for each article ID. You can instrument your code, or use the pcap trick above to capture the same data, visualize it, sample it, and trend it over time. You're now one step closer to building your own Google Dapper!
Invest into Tools & Instrumentation
Good instrumentation is the keystone of good performance practices. Finding the root cause of a regression after the problem has occurred, and without the past performance data is often like groping in the dark. The good news is, as we saw above, we have all the necessary pieces: a flexible, and easy to interpret data format, wide adoption, and plenty of great, existing tools to help analyze the data.
 Ilya Grigorik is a web ecosystem engineer, author of High Performance Browser Networking (O'Reilly), and Principal Engineer at Shopify — follow on Twitter.