Latency: The New Web Performance Bottleneck
 If we want a faster browsing experience then reducing the round trip time (RTT) should be near the top of our list. Or, as Mike Belshe put it: more bandwidth doesn't matter (much).
Now, let's be clear, higher bandwidth is never a bad thing, especially for use cases that require bulk transfer of data: video streaming, large downloads, and so on. However, when it comes to your web browsing experience, it turns out that latency, not bandwidth, is likely the constraining factor today. As a consumer, did you consider this when you picked your ISP? Likely not, I'm yet to see any provider mention, yet alone advertise latency.
Bandwidth vs. Latency
Akamai's State of the Internet stats show that as of 2011 an average US consumer is accessing the web on a 5Mbps+ pipe. In fact, with the fast growth of broadband worldwide, many other countries are hovering around the same number, or quickly catching up. As it happens, 5mbps is an important threshold.
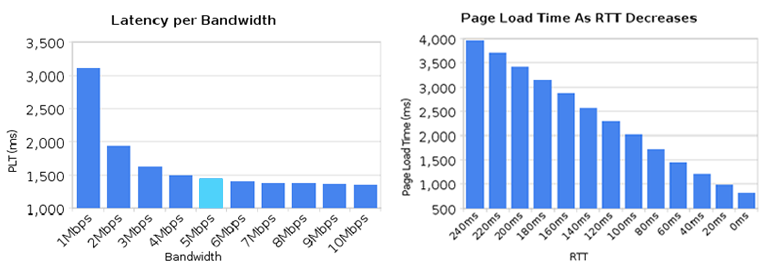
The two graphs above show the results of varying bandwidth and latency on the page load time (PLT). Upgrading your connection from 1Mbps to 2Mbps halves the PLT, but quickly thereafter we are into diminishing returns. In fact, upgrading from 5Mbps to 10Mbps results in a mere 5% improvement in page loading times! In other words, an average consumer in the US would not benefit much from upgrading their connection when it comes to browsing the web.
However, the latency graph tells an entirely different story. For every 20ms improvement in latency, we have a linear improvement in page loading times. There are many good reasons for this: an average page is composed of many small resources, which require many connections, and TCP performance of each is closely tied to RTT.
Developing an Intuition for Latency
So what is 20ms of latency? Most of us have a pretty good mental model for bandwidth as we are used to thinking in megabytes and file sizes. For latency, distance travelled by light is our best proxy:
Fiber RTT:
Radius: km / mi, RTT in vacuum: ms, RTT in fiber: ms.
Latency is constrained by the speed of light. Hence, 20ms RTT is equivalent to ~3000km, or a 1860 mile radius for light traveling in vacuum. We can't do any better without changing the laws of physics. Our data packets travel through fiber, which slows us down by a factor of ~1.52, which translates to 2027 km, or a 1260 mile radius. What is remarkable is that we are already within a small constant factor of the theoretical limit.
The above map models a simple, but an unrealistic scenario: you are at the center of the circle, what is the maximum one-way distance that the packet can travel for an X ms RTT? Unrealistic because the "Fiber RTT" assumes we have a direct fiber link between the center and the edge, but this nonetheless gives us a good tool to sharpen our intuition. For example, sending a packet from San Francisco to NYC carries a minimum 40ms RTT.
Grab the center of the circle, move it around, and you'll notice something very important: the Mercator projection we are all so used to seeing on our maps introduces a lot of distortion. The same 20ms at the equator covers a much larger "surface area" when moved either North or South.
Improving Bandwidth & Latency
Bandwidth demand is growing fast, but the good news is that we still have plenty of capacity within current fiber (~20% of lit capacity used), and even more importantly, the capacity can be improved by upgrades to existing submarine cables: capacity of trans-Pacific links tripled between 2007 and 2011, most of it through upgrades.
Latency on the other hand affords no such "easy" wins. Yes, the equipment can be improved to shave off a few milliseconds, but if you want significant improvements, then the answer is simple: you need new, shorter cables to reduce the propagation delay. As you may have guessed, this is an expensive proposition:
Huawei is working with another company, Hibernia Atlantic, to lay the first transatlantic fiber-optic submarine cable in a decade, a $400-million-plus project that will save traders five milliseconds. To do this, Hibernia is laying nearly 3,000 miles of cable across the Grand Banks off Canada and the North Atlantic, a shorter route that most companies have avoided because it traverses relatively shallow waters.
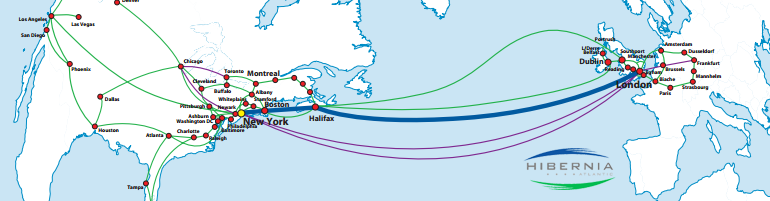
That's $80M+ per millisecond saved; latency is expensive - literally, and figuratively. Even more impressive, the theoretical limit between New York and London is 37.2ms, which means that this new cable (60ms RTT) only adds 38% of overhead for switching and amplification.
"Last Mile" latency & your ISP
40ms between NYC and London is great in theory, but in practice our ping times are much higher. When Mike Belshe published his study in 2010, average worldwide RTT to Google was ~100ms, and ~60-70ms within the US. In 2012, the average worldwide RTT to Google is still ~100ms, and ~50-60ms within the US. That's a positive trend within the US, but there is still a lot of room for improvement.
Turns out, the "last mile" connection between your house and your ISP is often a significant bottleneck. According to FCC's recent Measuring Broadband America report, during peak hours:
Fiber-to-the-home services provided 17 milliseconds (ms) round-trip latency on average, while cable-based services averaged 28 ms, and DSL-based services averaged 44 ms.
That's 17-44ms of latency just to the closest measuring node within your ISP, before your packet hits any internet backbone. You can run a simple traceroute to test your own ISP, my first hop (<60 miles) to Comcast fluctuates in the 15-45ms range (ouch):
$> traceroute google.com
traceroute to google.com (74.125.224.102), 64 hops max, 52 byte packets
 1  10.1.10.1 (10.1.10.1)  2.322 ms  1.084 ms  1.002 ms # local router
 2  96.157.100.1 (96.157.100.1)  38.253 ms  16.489 ms  24.702 ms # comcast
 ...
Mobile Web Latency: 100-1000ms
 The mobile web is a whole different game, and not one for the better. If you are lucky, your radio is on, and depending on your network, quality of signal, and time of day, then just traversing your way to the internet backbone can take anywhere from 50 to 200ms+. From there, add backbone time and multiply by two: we are looking at 100-1000ms RTT range on mobile. Here's some fine print from the Virgin Mobile (owned by Sprint) networking FAQ:
Users of the Sprint 4G network can expect to experience average speeds of 3Mbps to 6Mbps download and up to 1.5Mbps upload with an average latency of 150ms. On the Sprint 3G network, users can expect to experience average speeds of 600Kbps - 1.4Mbps download and 350Kbps - 500Kbps upload with an average latency of 400ms.
To add insult to injury, if your phone has been idle and the radio is off, then you have to add another 1000-2000ms to negotiate the radio link. Testing my own Galaxy Nexus, which is running on Sprint, shows average first hop at 95ms. If latency is important on wired connections, then it is a critical bottleneck for the mobile web.
"High Speed" Internet
If you are tasked with optimizing your site or service, then make sure to investigate latency. Google Analytics Site Speed reports can sample and report on real, user experienced latency of your visitors. Corollary: as a consumer, check the latency numbers in addition to the size of the pipe.
Finally, if we can't make the bits travel faster, then the only way to improve the situation is to move the bits closer: place your servers closers to your users, leverage CDN's, reuse connections where possible (TCP slow start), and of course, no bit is faster than no bit - send fewer bits. We need more focus, tools and discussions about the impact of latency, especially on high latency links such as the mobile web. "High speed" connectivity is not all about bandwidth, unlike what many of our ISPs would like to promote.
 Ilya Grigorik is a web ecosystem engineer, author of High Performance Browser Networking (O'Reilly), and Principal Engineer at Shopify — follow on Twitter.