Measuring Site Speed with Navigation Timing
 Fast and responsive services make for a great user experience. The problem is that most of us today lack the tools to reliably quantify this metric: server-side measurements do not take into account the network and the client-side latency, and most browser tools have poor visibility into the lower parts of the stack. As a result, in most cases we simply cross our fingers, optimize the individual components in a lab environment, and hope that it matches the user experience - which unfortunately is rarely the case.
If you want the complete picture on the user experience, you have to measure the latency from the client's perspective. Your server may respond in <50ms to incoming requests, but the DNS, a flaky routing path for the connection, or the three dozen external resources and a blocking JavaScript load can, and often do, result in a multi-second load time - that's how the user sees it!
W3C Navigation Timing
If we want to see the end-user perspective, then we need to instrument the browser to give us this information. Thankfully, the W3C Web Performance Working Group is ahead of us: Navigation Timing. The spec is still a draft, but Chrome, Firefox and IE have already implemented the proposal.
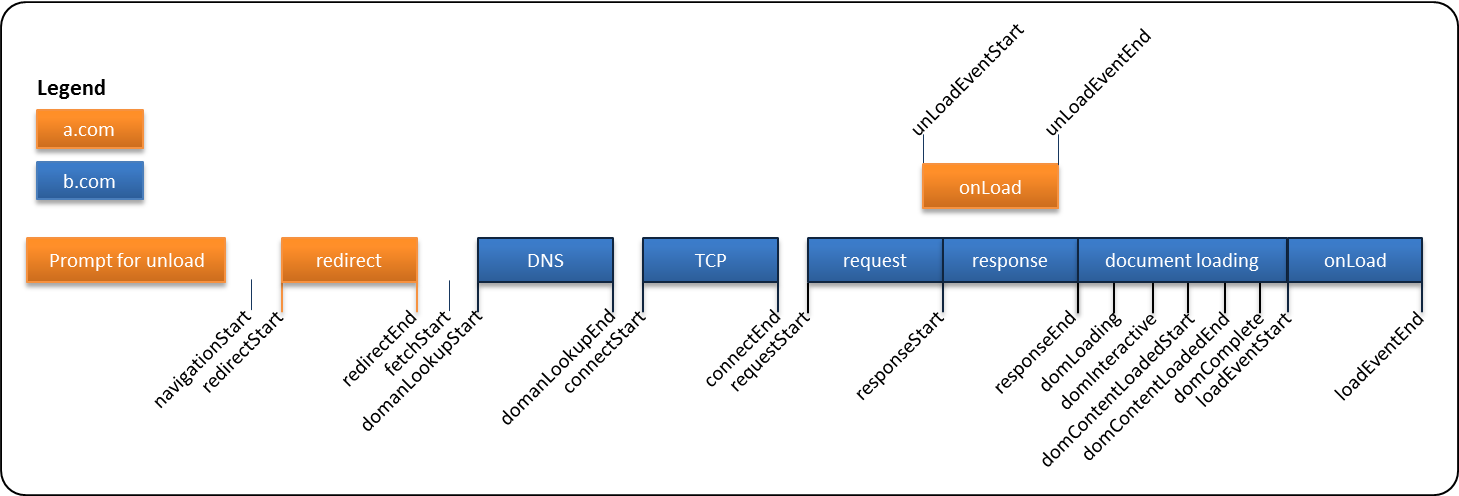
If it looks complicated, that's because it is! As you click on any link on this page the browser has to first unload the DOM, and then checks the AppCache for the requested resource. If that fails then we need to resolve the hostname (DNS), after which we can perform the TCP handshake (with optional SSL upgrade). Only once those roundtrips are done can we issue the HTTP request, at which time our server finally gets to work on the response, which in turn takes more time to stream back over an unreliable network (responseEnd). Now the browser can start loading the response body, repeating this process for every sub-resource (some in parallel, some blocking), and only then does the loadEventEnd fire.
There are many vendors and services that will be happy to help you optimize any particular part of this stack: DNS providers, server-side monitoring tools, CDN's, and so on. The problem is, none of those services give us the full picture. And to be fair, very few of us today are asking for it either - that's something we need to change.
Measuring "Perceived (User) Latency"
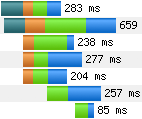
Navigation Timing is still a work in progress and there are a few notable implementation omissions: no Safari or iOS support, and no Opera implementations. Having said that, some data is better than no data and it is only a matter of time. If you are a Chrome user, open your Javascript console (Cmd-Opt-j on OSX) and type in performance.timing to see all of the above measurements for the current page. Alternatively, check out this Mozilla prototype for a great visual demo, or add one of these browser bookmarklets to see the stats on-demand for any page in your browser.
Google Analytics + Site Speed Reports
A little known feature of Google Analytics is that it already provides a number of "Site Speed" reports based on the Navigation Timing data! To get started, open up your profile and head to Content > Site Speed. Disclaimer: I work with the GA team.
![]() By default, the
By default, the ga.js tracker will sample this data from 10% of your traffic, up to 10K visits a day - if you are not hitting the upper limit, raise your sampling rate! With that in place, we can now start looking at the true, end-to-end user latency distributions. Keyword: distributions.
Site Speed reports offer a lot of great metrics such as average response times (yes, server response times in GA!), DNS latency, as well as a dozen other metrics and dimensions. However, unfortunately averages only muddy the waters: if you are investigating performance as a function of time, then you need to look at the underlying distribution of the data. Throw away the averages, we need histograms!
Performance Distributions: igvita.com
Head directly to Content > Site Speed > Page Timings > Performance, in fact, make that your homepage. There you will find the histograms for all of the key metrics: DNS, redirection, server connection & response, download, and page load times. As a hands on example, let's look at some data for igvita.com:
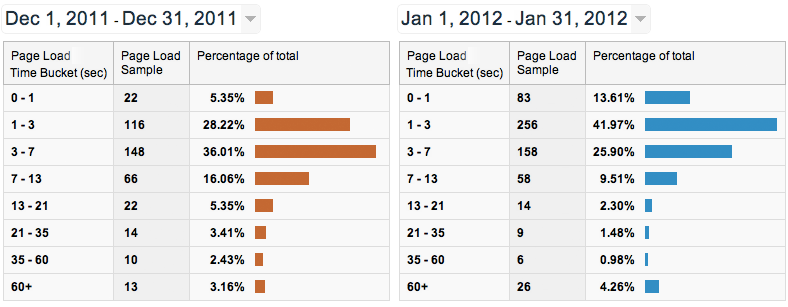
A typical skewed distribution for the overall page load time. Except that, in January there is a noticeable shift! I happen to have migrated the site from Wordpress to Jekyll, and introduced a new optimized theme on Dec 31st. Looks like the effort definitely paid off: 50%+ of page loads are now in sub 3 seconds.
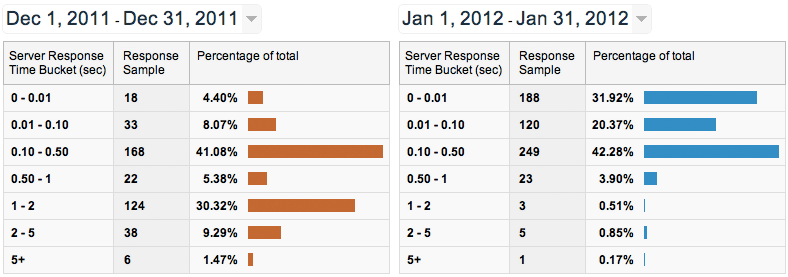
The server response time histogram is much more interesting. Yes, the average response time went from 910ms to 220ms, but what the average obscures is the bimodal distribution of the data, for which we can form a hypothesis: the first peak is when a user hits a cached object; the second requires a fetch and/or extra server work. In fact, on many sites it is not uncommon to find three peaks: client cache hit response, server cache hit, and a full server render!
Finally, because the data lives in GA, we can now also slice and dice it with respect to any number of visitor dimensions: continent, city, browser version, and so on. If you are not familiar with advanced segments in GA, then now is a good time to get up to speed. For example, how does a new visitor (cold cache) from Beijing compare to a visitor from San Francisco?
Understanding the "Shape of the Data"
If your job is to think about performance, then you need to approach it from a users perspective: networks are flaky, caches are small, devices are slow, and DOM rendering is a complicated beast. Navigation Timing is a critical piece that will help us put all of this together. Google Analytics provides some great tools to make sense of this data, but I'm hoping to see many more in this space in the future.
We need tools that will enable us to understand our site performance from the perspective of a real user, and tools that will move beyond just computing the average. After all, an average of a skewed, or a multi-modal distribution tells us very little: dig into the data, understand the shape of it, and optimize from there.
 Ilya Grigorik is a web ecosystem engineer, author of High Performance Browser Networking (O'Reilly), and Principal Engineer at Shopify — follow on Twitter.