Speed Tracer Server-side Tracing with Rack
 As anyone who has ever developed an interactive web app will know, Firebug (Firefox) and Inspector (Webkit) are your best friends. In fact, in many cases these tools are the "IDEs of choice" for manipulating the DOM, debugging JavaScript, and even working with CSS. However, have you ever wondered how many CPU cycles that script really took, or how much time the browser spent in reflow, as compared to just parsing the data? That's where Google's Speed Tracer comes in. Provided as a Chrome extension, it instruments the V8 VM, and the rest of the browser to provide detailed data about the GC cycles, painting, parsing, network resource loading and more.
The low level data provided by Speed Tracer finally allows us to peek under the covers to understand what the browser is actually doing - think strace, but for your browser. However, what if we could also bridge the gap between client-side and server-side tools? Wouldn't it be nice if we could go beyond the simple latency and response time reporting for network resources to viewing a full server-side log of what happened, all in one tool? Well, that's exactly what the Speed Tracer team launched at Google IO, so lets take a look at how it works!
Server-side tracing with SpeedTracer
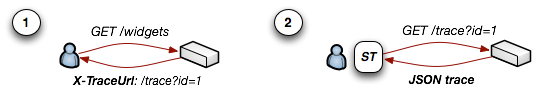
The actual mechanics of getting server-side performance data into Speed Tracer are clever and simple. Whenever the browser receives a network response, it looks for the X-TraceUrl header, which specifies the relative URL and the unique ID of the trace for that specific request. From there, if the developer expands the network resource which provided the X-TraceUrl, Speed Tracer makes a request for the server-side trace, parses the JSON and surface it in the UI. This means that the server-side data is brought in on demand and does not affect the actual load times of your resources, and also that you need a mechanism to record, store, and serve these traces later.
Server side tracing with Rack & Ruby
The original announcement at Google IO demoed this new functionality on top of GWT and the Spring TC server. However, this same functionality is also easily extracted into a Rack middleware - which is what I did. In fact, here is a preview of sample trace from a Rails 3 application using rack-speedtracer:
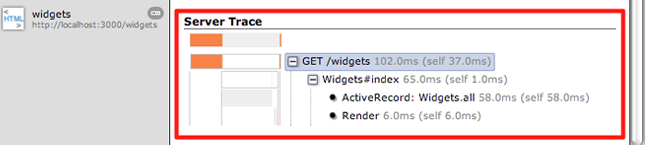
The middleware takes care of providing the headers, persisting the traces, and then serving all the data back to Speed Tracer in the format it expects and understands under the hood. As a developer, you simply need to require the middleware, and then instrument your code where you want performance data to be recorded. Let's take a look at a simple configuration for a Rails 3 application:
# in your Gemfile
gem 'rack-speedtracer', :require => 'rack/speedtracer'

# in development.rb environment
config.middleware.use Rack::SpeedTracer

# define a widgets controller
class WidgetsController < ApplicationController
  def index
    env['st.tracer'].run('Widgets#index') do
      env['st.tracer'].run("ActiveRecord: Widgets.all") do
        Widget.all
      end

      env['st.tracer'].run('Render') { render :text => 'oh hai' }
    end
  end
end
rack-speedtracer - SpeedTracer Rack middleware
At the moment, you need to manually instrument your code to record this data, but there is also no reason why we couldn't automagically instrument Rails to provide detailed breakdowns of what is going on inside - rack/bug is a great example. Of course, this functionality is not limited to Rails, and will work for any Rack application. There are still a few missing pieces in rack-speedtracer (see readme - patches are needed and welcome!) before you can deploy it in production, but it will work great for development purposes.
Towards unified client & server debugging
Having both the server-side and client-side performance data in a unified view can make our lives, as developers, an order of magnitude simpler - tired of correlating server logs with your browser yet? Having a mechanism to view this data on-demand, and in a single place is exciting, and I hope that the Speed Tracer team continues to innovate in this direction.
It would be great to see more metadata about code locations, exceptions, object instantiation, and so on from within the same UI. But in the meantime, do install it, play with it, and give rack-speedtracer a try.
 Ilya Grigorik is a web ecosystem engineer, author of High Performance Browser Networking (O'Reilly), and Principal Engineer at Shopify — follow on Twitter.