Load Testing With Log Replay
 Performance testing can be a tricky proposition, how many times have you deployed code that fell apart in production? (Hey, we've all done it!) Having a staging environment, which replicates the data and deployment environments are great first steps, but even that often falls short from producing reliable results. And that is where load testing comes in: we need to test our application in the context of a multi-user audience interacting with all of the components of our site. Great, but how do we do that? Well, why not just grab the access logs from your current production environment, and replay them!
Performance & Benchmarking tools
If you start looking, you'll find an abundance of benchmarking applications, but the commonly cited industry standards are: Apache Bench, JMeter, httperf, and Siege.
Apache Bench (or 'ab', on the command line) is usually the crowd favorite as it is ubiquitous due to being packaged alongside the Apache web-server - and for a good reason, it's a great benchmarking tool. However, while it can generate a significant concurrency load, the requests are always identical (Siege also has this limitation), as it has no mechanism for simulating a collection of user sessions:
# make 100 requests, opening 20 concurrent requests at a time
$ ab -n 100 -c 20 http://localhost/
# ...snip...
# Concurrency Level:      20
# Time taken for tests:   0.78639 seconds
# Complete requests:      100
Simulating user sessions
Benchmarking a single endpoint is an important use case, but oftentimes we should really be testing an entire transaction: a series of user-initiated requests simulating a common use case of your web application (searching for, and purchasing an item; updating a profile; etc.). In the load testing world, this is also commonly known as simulating a session.
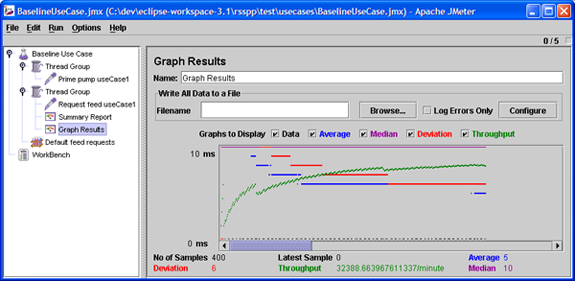
JMeter is the tool that you're looking for if you need to create a series of highly customizable interactions. While the UI of JMeter can be definitely confusing at first, a good guide and some experimentation will allow you to create custom scripted sessions with cookies, login and logout actions, and anything else your heart might desire.
But while JMeter is nice, it's definitely a heavy-weight, and that's where httperf comes into the picture (http_load is also a great app, albeit without many of the features of httperf). Unlike JMeter, httperf is powered from the command line and offers a much simpler (but feature rich) path for simulating a collection of users.
Httperf under the hood
Created at the HP Research Labs (see original paper), and more recently updated by researchers at University of Calgary, httperf packs a lot of functionality under the hood: url generation, burst support, think times, GET/POST queries in the session file, and different concurrency rates amongst many others.
To get started with httperf, check out Sofia Cardita's great introductory guide, as well as the slides and the quickstart guide from Theodore Bullock's presentation at WWW2007.
AutoPerf: Ruby httperf driver
Finally, putting all of the pieces of the puzzle together, how do we run a simple, log-replay load test for a Rails application? First, we need a log file, let's say from Nginx, and then we need to convert it into a format httperf can understand:
# Grab the last 1000 requests from production Nginx log, and extract the request path (ex: /index)
$ tail -n 1000 nginx.log | awk '{print $7}' > requests.log

# Replace newlines with null terminator (httperf format)
$ tr "\n" "\0" < requests.log > requests_httperf.log

# Run an httperf test, using our replay log
# - test localhost deployment
# - simulate 100 concurrent users
# - stop after 10000 requests have been made
$ httperf --hog --server localhost --port 80 --wlog=n,requests_httperf.log --rate=100
Running one of these tests will provide you with a mountain of data, but how do you map the performance curve as request rate changes? Do you know at which point your server becomes saturated? To help with this task, I've created autoperf.rb, a small Ruby driver for httperf. Let's create a simple execution plan for it:
# Autoperf Configuration File

# The host and port to test.
host = localhost
port = 80

# The 'rate' is the number of number of connections to open per second.
# A series of tests will be conducted, starting at low rate,
# increasing by rate step, and finishing at high_rate.
low_rate  = 100
high_rate = 200
rate_step = 20

#################
# httperf options (prefix with 'httperf_')

httperf_wlog      = n,requests_httperf.log

# num_conn is the total number of connections to make during a test
# num_call is the number of requests per connection
# The product of num_call and rate is the the approximate number of
# requests per second that will be attempted.
#httperf_num-conns = 20
httperf_num-call  = 1

# timeout sets the maximimum time (in seconds) that httperf will wait
# for replies from the web server.  If the timeout is exceeded, the
# reply concerned is counted as an error.
httperf_timeout   = 5
autoperf.git - Ruby httperf driver on GitHub
With that in place, we're ready to go:
$ ruby autoperf.rb -c autoperf.conf
# ...
# +----------------------------------------------------------------+
# | rate | conn/s | req/s | replies/s avg | errors | net io (KB/s) |
# +----------------------------------------------------------------+
# |  100 | 99.9   | 99.9  | 99.7          | 0      | 45.4          |
# |  120 | 119.7  | 119.7 | 120.0         | 0      | 54.4          |
# |  140 | 139.3  | 139.3 | 138.0         | 0      | 63.6          |
# |> 160 | 151.9  | 151.9 | 147.0         | 0      | 69.3          |
# |  180 | 132.2  | 129.8 | 137.4         | 27     | 59.6          |
# |  200 | 119.8  | 117.6 | 139.9         | 31     | 53.9          |
+----------------------------------------------------------------+
As you can see, the server became saturated at about 160 req/s based on the access patterns generated in our production environment - a far better benchmark than testing a single endpoint. Best of all, now you can map your performance benchmarks to real user sessions in an automated and repeatable fashion. No more falling down in production!
 Ilya Grigorik is a web ecosystem engineer, author of High Performance Browser Networking (O'Reilly), and Principal Engineer at Shopify — follow on Twitter.