Building a Faster Web
Make The Web Fast (MTWF)
Make the entire web faster
- Kernel, Networking, Mobile, Chrome, Infrastructure, ...
- Research & drive performance web standards (W3C, etc)
- Build open source tools, contribute to existing projects
- Optimize Google, optimize the web...
Usability Engineering 101
| Delay | User reaction |
|---|---|
| 0-100 ms | Instant |
| 100-300 ms | Feels sluggish |
| 300-1000 ms | Machine is working... |
| 1 s+ | Mental context switch |
| 10 s+ | I'll come back later... |
Usability Engineering - Jakob Nielsen, 1993
- SLOW
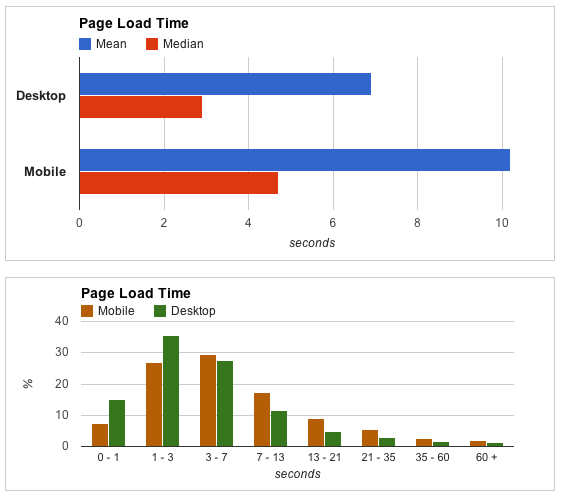
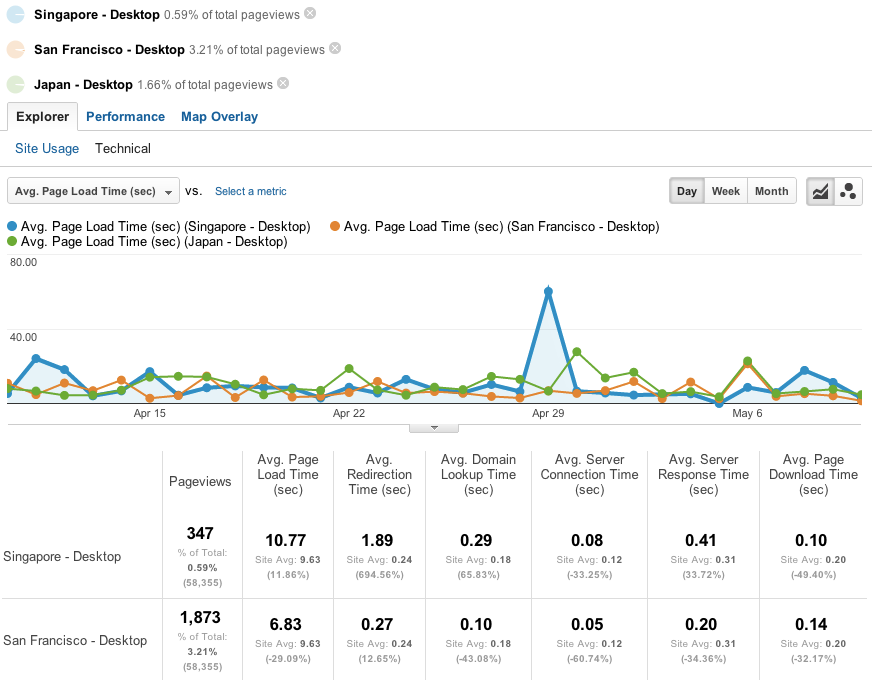
How Fast Are Websites Around The World? - Google Analytics Blog (April, 2012)
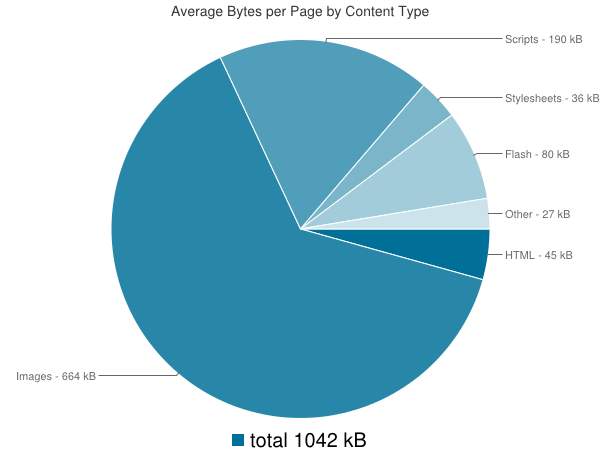
| Content Type | Avg # of Requests | Avg size |
|---|---|---|
| HTML | 8 | 44kB |
| Images | 53 | 635kB |
| Javascript | 14 | 189kB |
| CSS | 5 | 35kB |
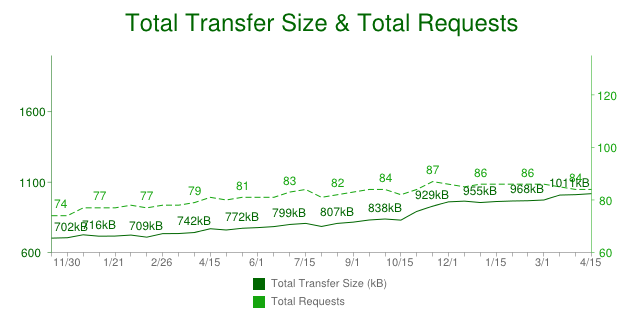
HTTP Archive - Trends (April, 2012)
HTTP Archive - Trends (April, 2012)
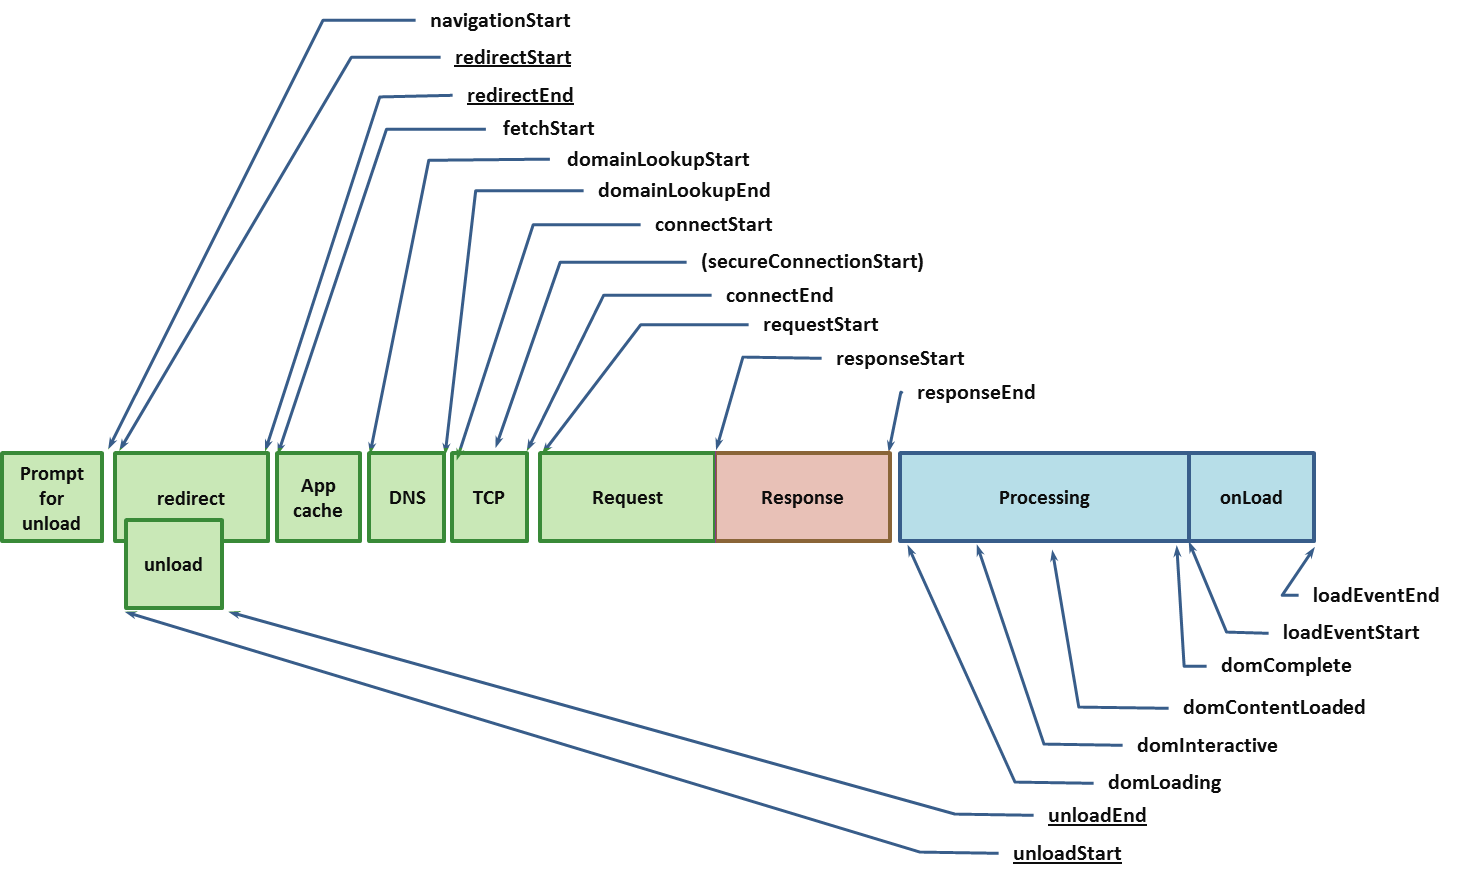
- Unload the DOM
- DNS resolution
- Connection & TCP handshake
- Send request, wait for response
- Parse response
- Request sub-resources (see step 1)
- Execute scripts, apply CSS rules
(short) life of a web request...
- user's connectivity
- server
- browser execution
- user's perceived page load time!
It's complicated...
| DNS Resolution | 130ms average, see Google DNS |
| TCP handshake | TCP Fast Open & CWND proposals |
| Request pipelining | SPDY: multiplexing, compression, ... |
| Parsing & execution | You're running Chrome, right? |
The (almost) free lunch*
* Incremental improvements in the stack, magnitude improvements in your code.
Bandwidth will not save us!
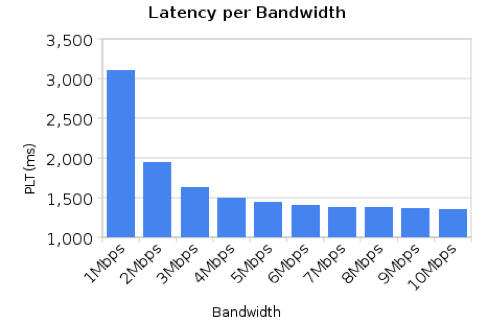
Modest to no noticeable speedup after 5mbps! Errrrr.. why!?
- TCP connections are expensive
- TCP connections "start slow" - see TCP slow-start
- Most TCP connections don't reach their bandwidth limit
- 1/3 of requests open a new TCP connection
84 requests on average...
How did the user see it?
Created via webpagetest.org: IE 8, from Tokyo... Yikes?
(faster) connectivity won't save us, better protocols can help, but...
We need to build faster pages
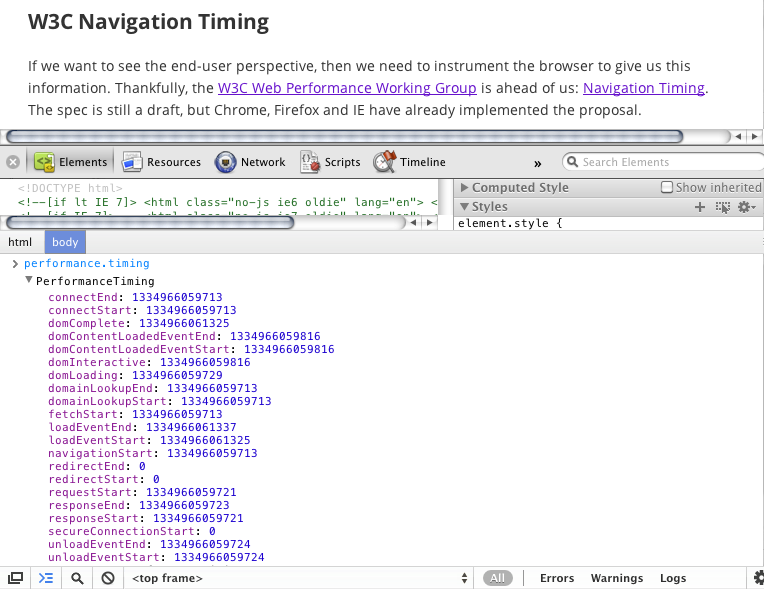
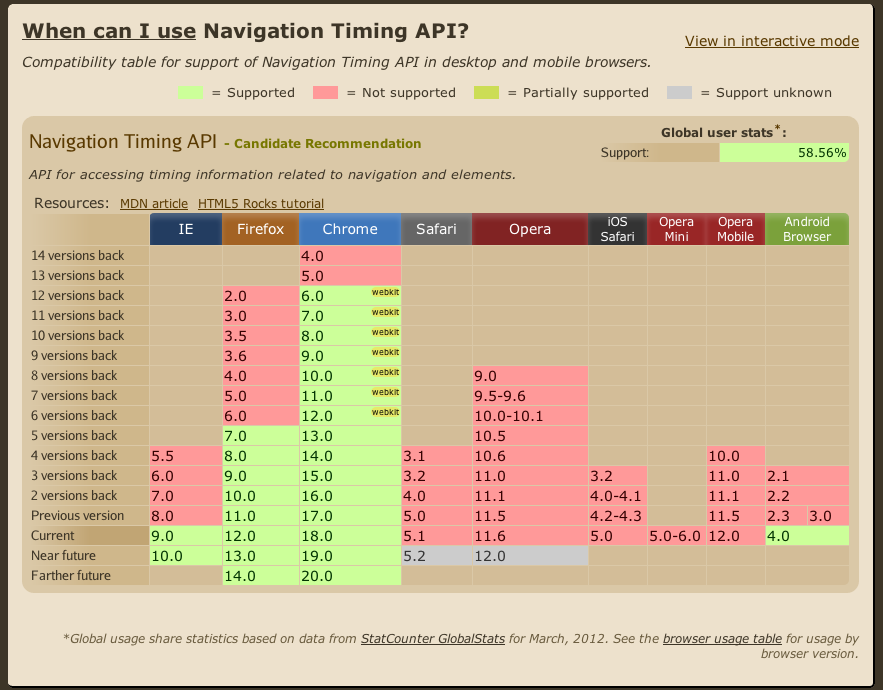
Navigation Timing (W3C)
<script>
  _gaq.push(['_setAccount','UA-XXXX-X']);
  _gaq.push(['_setSiteSpeedSampleRate', 100]); // #protip
  _gaq.push(['_trackPageview']);
</script>
- Defaults to 5% sampling rate
- Max sample is 10k visits/day
- GA advanced segments FTW!
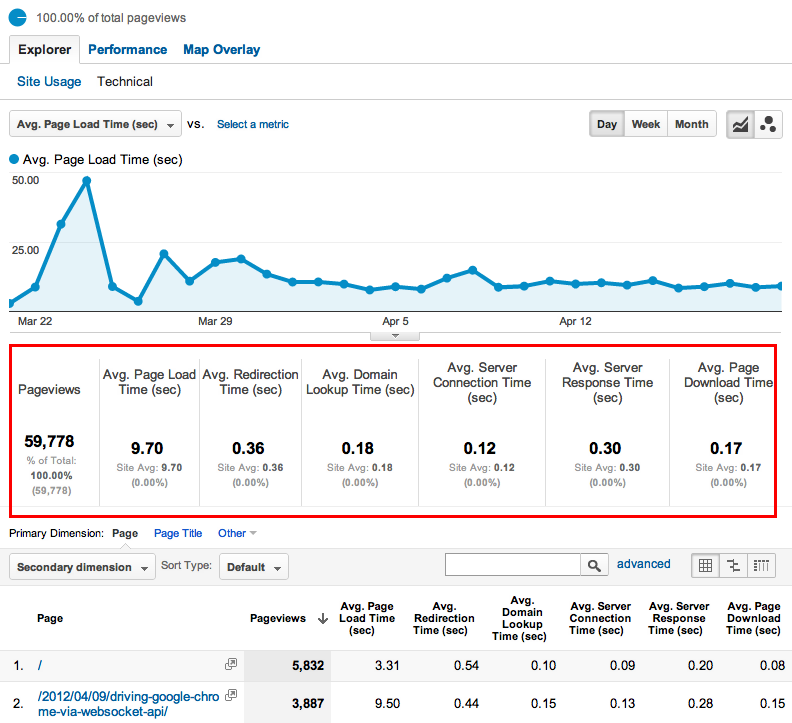
Google Analytics > Content > Site Speed
setSiteSpeedSampleRate docs / Yahoo's Boomerang
No instrumentation
required
required
Segment by:
geo, browser, UA, ...
geo, browser, UA, ...
Averages (often) lie!

Skeweness - Wikipedia
Place your...

</chrome meta>
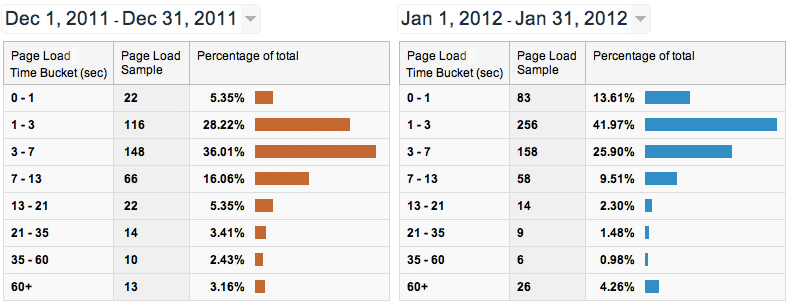
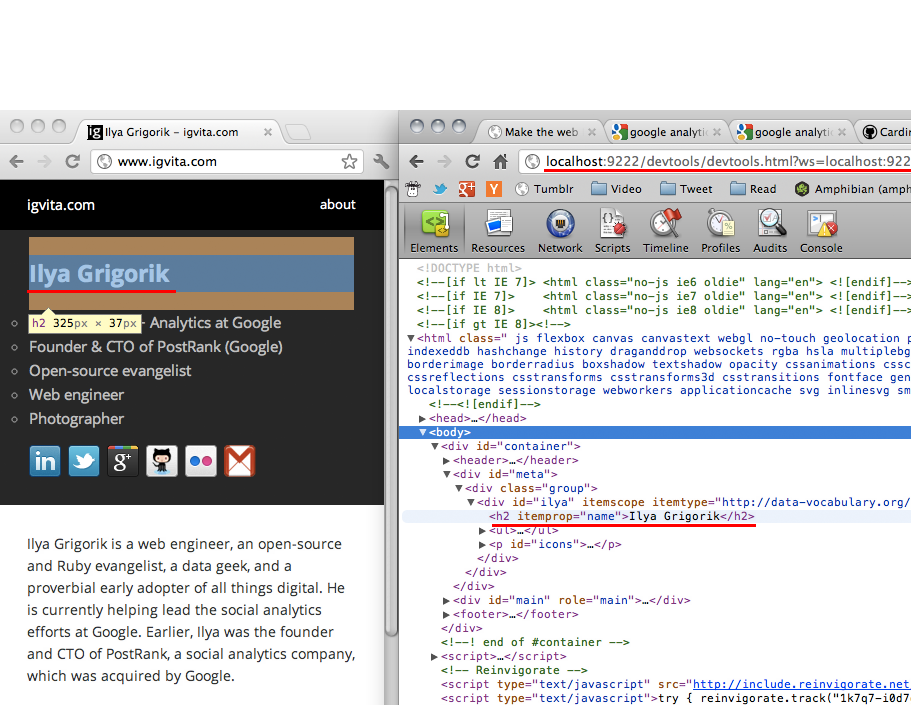
Case Study: igvita.com Page Load Time
Content > Site Speed > Page Timings > Performance
Migrated site to new host, server stack, web layout, and using static generation. Result: noticeable shift in the user page load time distribution.
Measuring Site Speed with Navigation Timing - igvita.com
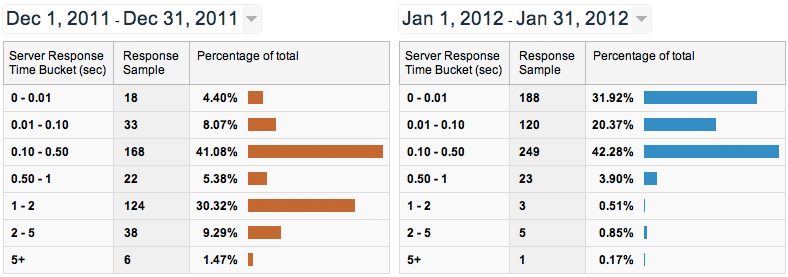
Case Study: igvita.com Server Response Time
Content > Site Speed > Page Timings > Performance
Bimodal response time distribution?
Theory: user cache vs. database cache vs. full recompute
Measuring Site Speed with Navigation Timing - igvita.com
(ab) using GA "user timings" reports
- "method to track periods of time in Google Analytics"
- AJAX calls, timer intervals, user interactions
<script>
  _gaq.push(['_trackTiming', 'category', 'label', time]);

  _gaq.push(['_trackTiming', 'jQuery', 'Load library', 20]);
  _gaq.push(['_trackTiming', 'slide', slideNum, timeOnSlide]);
  //                                            ^^^ win.
</script>
ResourceTiming interface to allow Javascript mechanisms to collect complete timing information related to resources on a document.
W3C draft / work in progress
ResourceTiming draft, follow webkit status
Measure, analyze, optimize, repeat...
- Measure user perceived latency
- Use Navigation Timing data
- Use GA's advanced segments!
- Setup {daily,weekly, ...} reports
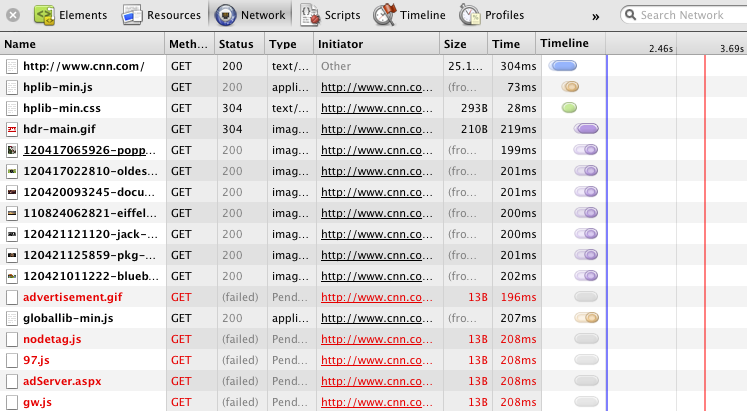
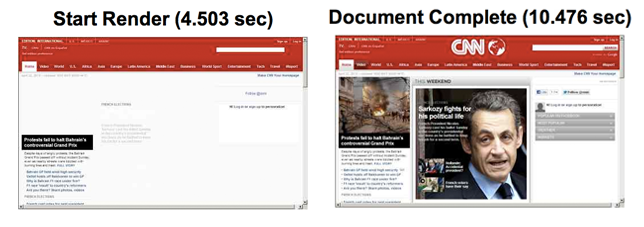
cnn.com waterfall: blocking JS requests, missing assets, missing cache headers on images and JS. Plenty of room for improvement.
Question: what are the blue and red lines in the waterfall?
- DOMContentLoaded fires when parsing is complete
- onload fires when all resources loaded (spinner stops)
Place your...
- CSS at the top
- JavaScript at the bottom (defer it!)
DOMContentLoaded vs. onload
DOMContentLoaded test drive
DOMContentLoaded vs. onload
cnn.com loading time: ~15s (+5s after onload)
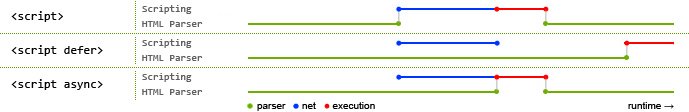
async vs. defer
<script src="file-a.js"></script>
<script src="file-b.js" defer></script>
<script src="file-c.js" async></script>
What's the difference?
async vs. defer
<script src="file-a.js"></script>
<script src="file-b.js" defer></script>
<script src="file-c.js" async></script>
- regular: wait for network, execute, proceed
- defer: download in background, execute in order before DomContentLoaded
- async: download in background, execute when ready
#protip: investigate a good script loader
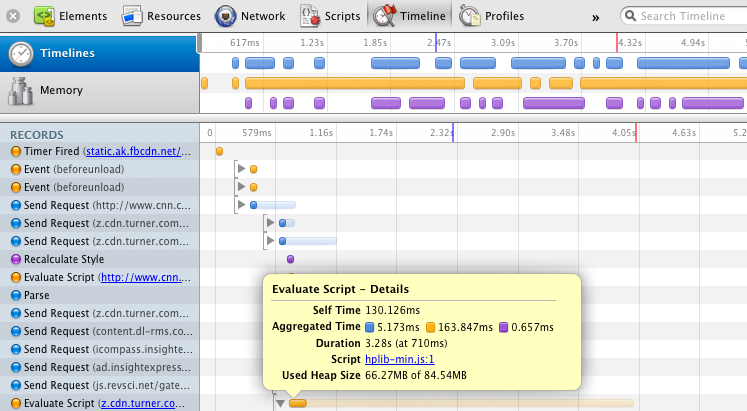
cnn.com timeline: evaluate every request, track JS execution time, style reflows, etc.
60%+ of the weight of the page is images (on average)
Images * 53
Portable "Network" Graphics (PNG) != always PNG
- Regular PNG from photoshop
- "Crushed" PNG
- JPEG at 100%
- JPEG at 85%
#protip: automate it.
- Navigation Timing API for user latency
- Google Analytics + Site Speed
- Unblock onload!
- Optimize your images
- Use Chrome Dev Tools: Network, Profiler, ...
Measure twice before you optimize
Chrome DevTools is a web app!
<chrome meta>- No magic, pure HTML fun
- Remote debugging.. via Chrome!
</chrome meta>
Remote Debugging + Performance Analysis
$> Google Chrome --remote-debugging-port=9222
$> curl localhost:9222/json
[ {
   "devtoolsFrontendUrl": "/devtools/devtools.html?host=localhost:9222&page=1",
   "faviconUrl": "",
   "thumbnailUrl": "/thumb/chrome://newtab/",
   "title": "New Tab",
   "url": "chrome://newtab/",
   "webSocketDebuggerUrl": "ws://localhost:9222/devtools/page/1"
} ]
- Each open tab is a process
- Each process has a ws:// debug URL
Driving Google Chrome via WebSocket API - igvita.com
Remote DOM + Debugging FTW!
Driving Chrome from CLI
ws = Faye::WebSocket::Client.new(resp.first['webSocketDebuggerUrl'])
ws.onopen = lambda do |event|
  ws.send JSON.dump({id: 1, method: 'Network.enable'})

  ws.send JSON.dump({
    id: 2,
    method: 'Page.navigate',
    params: {url: 'http://twitter.com/#!/search/html5?q=html5&' + rand(100).to_s}
  })
end

ws.onmessage = lambda do |event|
  p [:new_message, JSON.parse(event.data)]
end
Driving Google Chrome via WebSocket API - igvita.com
responseReceived event
"method":"Network.responseReceived",
"params":{
  "type":"XHR",
  "response":{
     "url":"http://api.twitter.com/1/trends/available.json?lang=en",
     "status":200,
     "statusText":"OK",
     "mimeType":"application/json",
     "connectionReused":false,
     "fromDiskCache":false,
     "timing":{
        "requestTime":1333830921.9814498,
        "connectStart":1,
        "receiveHeadersEnd":234
        // ...
Network.responseReceived - gist of sample event
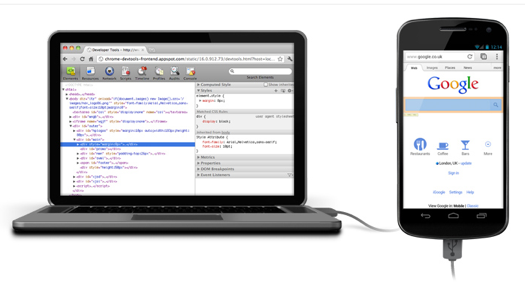
Connect your Android device via USB to the desktop & view and debug the code executing on the device
Chrome for Android
- PageSpeed Insights
- PageSpeed Insights + browser plugins (Chrome, FF)
- mod_pagespeed
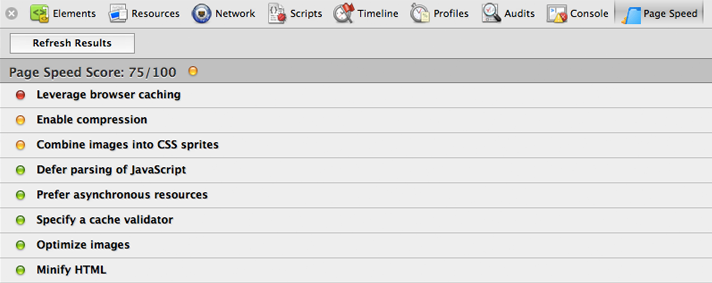
 Google PageSpeed
PageSpeed Insights

- 0-100 score (the higher, the better)
- Desktop + Mobile optimized analysis & recommendations
- 31+ optimization rules (and growing)
- Demo: cnn.com
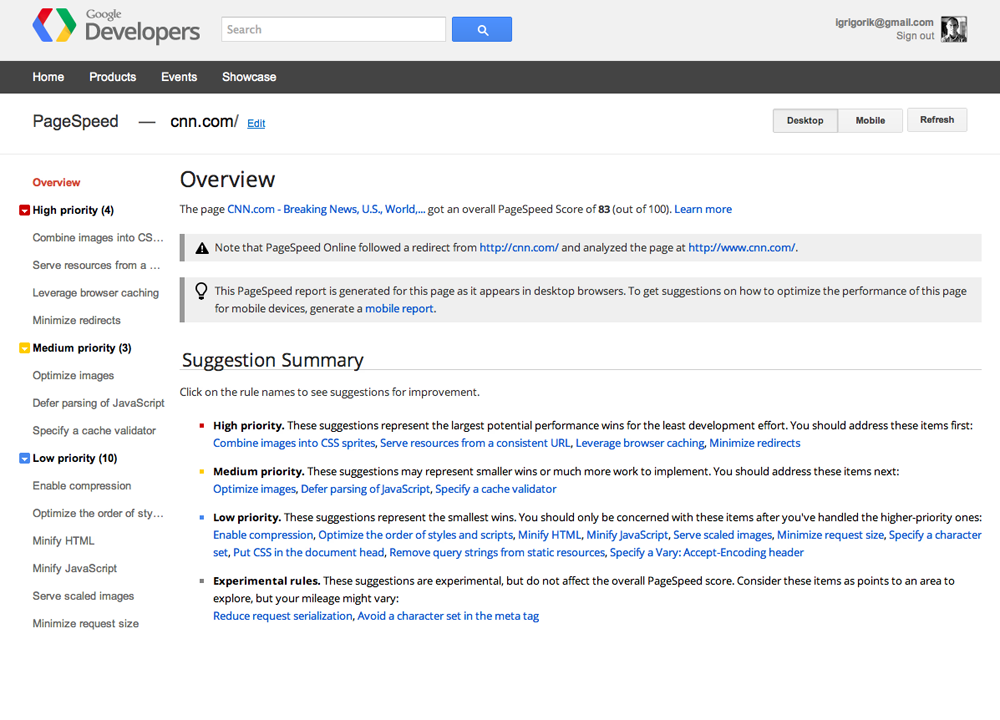
demo: cnn.com
PageSpeed Online API
require 'net/https'
require 'json'

uri  = URI.parse('https://www.googleapis.com/pagespeedonline/v1/runPagespeed')
http = Net::HTTP.new(uri.host, uri.port)
http.use_ssl = true

params = { :key => 'API KEY', :url => 'http://railsconf2012.com/',
           :strategy => 'desktop', :rules => '...' }

uri.query = URI.encode_www_form(params)
req = Net::HTTP::Get.new(uri.request_uri)
res = http.request(req)

jj JSON.parse(res.body)
API Documentation, widget examples, etc.
PageSpeed Browser Plugins
- Browser integration for Chrome & Firefox
- Open-source SDK for embedding (same rules, same code)
- Active pagespeed community
- Your page won't reach 100 (unless it's blank)
- Every resource on your page has a cost
- You should know the cost of each resource
- Not everything should be cached for N years
Goal: no surprises in the recommendations.
But PageSpeed Insights tells me to...

mod_pagespeed
Open-source Apache module that automatically optimizes web pages and associated resources.
ModPagespeedCssInlineMaxBytes                2048
ModPagespeedImageInlineMaxBytes              2048
ModPagespeedCssImageInlineMaxBytes           2048
ModPagespeedJsInlineMaxBytes                 2048
ModPagespeedCssOutlineMinBytes               3000
ModPagespeedJsOutlineMinBytes                3000
ModPagespeedRetainComments                   "[WILDCARD PATTERN]"
ModPagespeedJpegRecompressionQuality           -1
ModPagespeedImageLimitOptimizedPercent        100
ModPagespeedImageLimitResizeAreaPercent       100
ModPagespeedMaxInlinedPreviewImagesIndex        5
ModPagespeedMinImageSizeLowResolutionBytes  10240
// ...
mod_pagespeed = automagic optimization
<VirtualHost *:80>
    ServerName www.your-awesome-html5-app.com
    DocumentRoot /apps/foo/public

    ModPagespeed on

    /* ... */
</VirtualHost>
- Dozen's of automatic filters (and growing)
- Inlining, optimization, resizing, headers, UA patterns, etc.
PageSpeed Service fetches content from your servers, rewrites the pages by applying web performance best practices and serves them to end users via Google's servers across the globe.
Setup:
- Alias DNS CNAME entry to ghs.google.com.
- Sit back and enjoy
Stay tuned for more...
PageSpeed Service (beta)
- Half the battle is knowing what to to measure
- Measure user perceived latency
- Optimize from user's perspective
- Mobile web is 1.5x slower on average!
- No excuses, the tools are there *
- Plenty of better tools to be built still
- Automate what you can - tip: mod_pagespeed :-)
Food for thought...
+Ilya Grigorik, @igrigorik, igrigorik@google.com
Blog @ www.igvita.com
Slides: bit.ly/html5devconf-speed