A whirlwind tour of DevTools tips and tricks


  • Part I: DevTools tips, tricks and awesome features  (video)
  • Part II: Extending DevTools, Debug Protocol, Extensions, ... (video)

  • Follow along @ bit.ly/devtools-tips


Elements & Console


  • Drag & Drop to reorder elements
  • $0 to inspect selected element in console
  • Break on node removal -
  • cmd-? to become a keyboard ninja

Customize your settings!


  • Disable cache and (re)gain some sanity
  • Log XHR's for easier debugging
  • Keep my color markup (personal pet peeve)
  • Show paint rectangles (more on this later)

Network Timeline


  • Pay attention to the text in gray...
  • What is the HTTP overhead on each request?
  • What is the time to first byte (TTFB) for each request?
  • Which is the slowest resource by response time?
  • Which is the slowest resource by duration?

Who initiated the resource load?


  • Was it the document parser?
  • Was it your JavaScript resource loader?

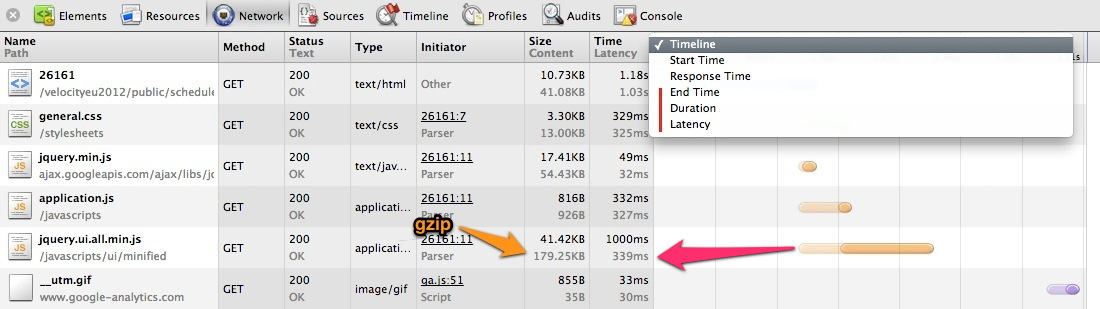
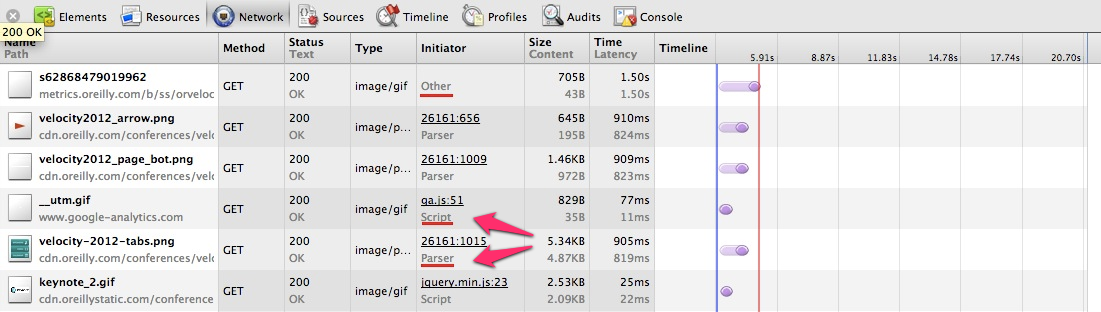
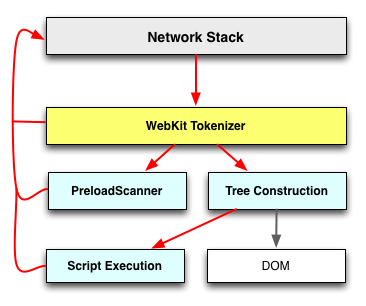
Resource loaders are great, except.. when they hide the resources excessively.

Flush early, flush often


There is an entire performance talk in the above waterfall..

  • Fast TTFB for page header, but (very) slow body render
  • Document parser doesn't wait, schedules the CSS
  • The CSS is queued, waiting for first byte for over 1s!
  • PreloadScanner can fetch resources while parser is blocked (early flush example)

"You get used to it. I don't even see the waterfall. All I see is server stalls, queued requests, ..." :-)

Let the browser do its job...

  • Flush early, flush often, flush smart
  • Time to first packet matters when...
  • Content of first packet can tip-off the parser

  • CSSPreloadScanner scans for @import's only
  • Scheduling resources from scripts is expensive
  • Don't hide resources from the parser!

Inspect WebSocket Frames


  • Inspect the WS handshake
  • Inspect the individual WS frames
  • Green: frames sent by your client (demo server)

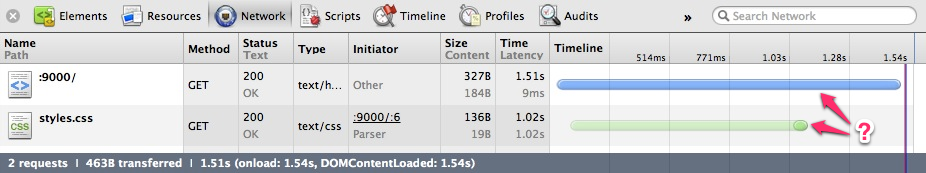
If you're shuffling binary data, you'll need a custom viewer...

Record a trace & export the waterfall


  • Hit "record" to capture a multi-page trace
  • Export request meta-data: right click, "Copy Entry as HAR"
  • Export entire waterfall: right click, "Copy All as HAR"


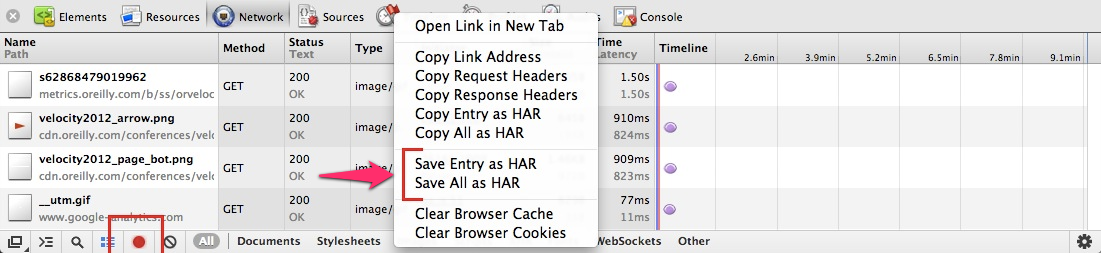
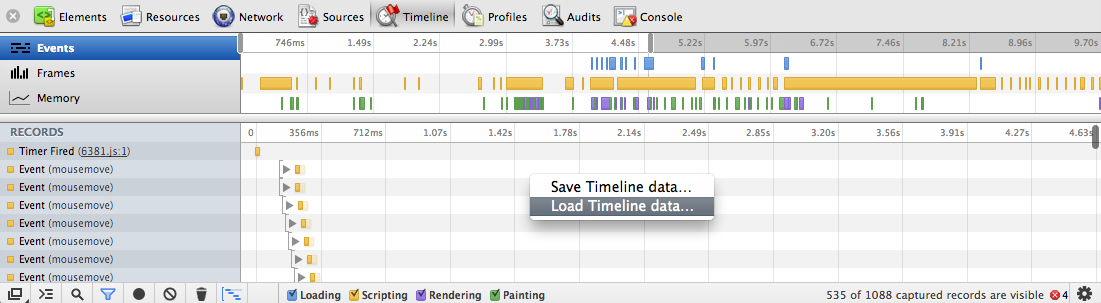
What's a HAR? HTTP Archive format!

 # quick waterfall viewer!
$ gem install har
$ har trace.har

# capture a HAR file from the CLI
$ phantomjs examples/netsniff.js http://www.igvita.com/ > igvita.har

# run YSlow on the waterfall
$ npm install yslow -g
$ yslow --info basic --format plain igvita.har
    size: 67.0K (67000 bytes)


Let's build a Render tree...

Or, maybe an entire forest?

Welcome to the Render forest!


  • Some trees share objects
  • Trees are constructed independently
  • Lazy evaluation, browser tries to defer work whenever possible!
  • Querying layout forces a flush (e.g. offsetWidth, offsetHeight)
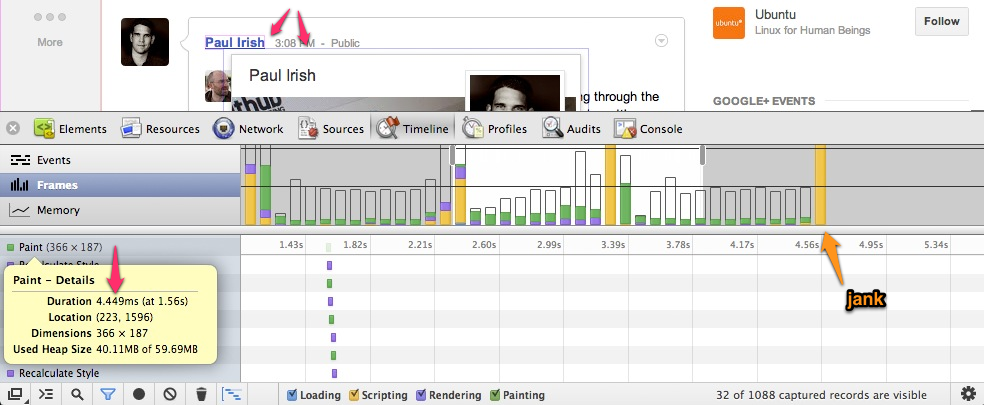
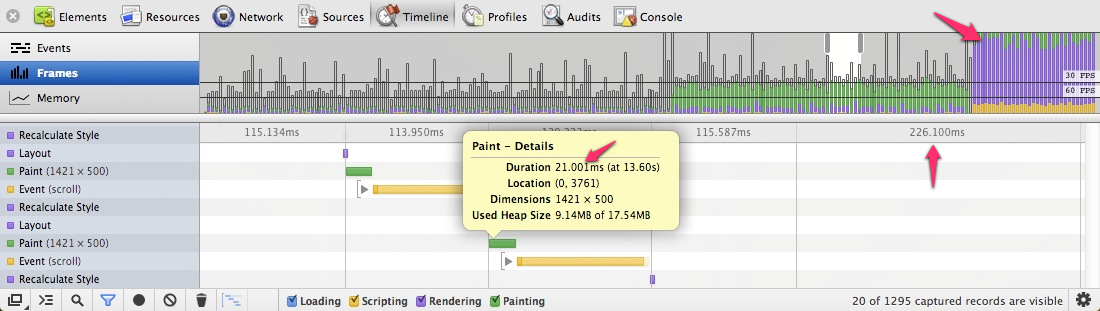
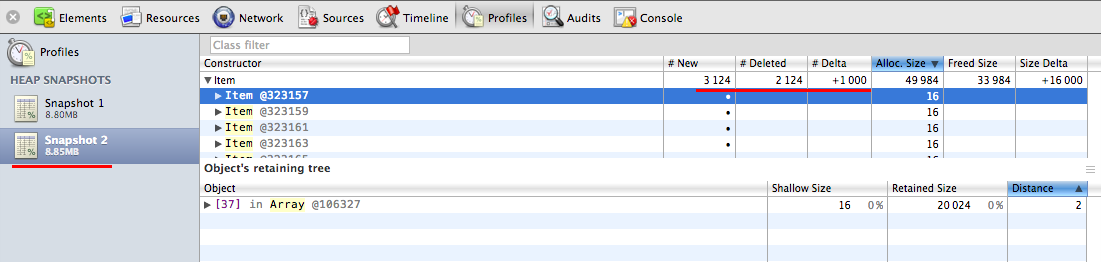
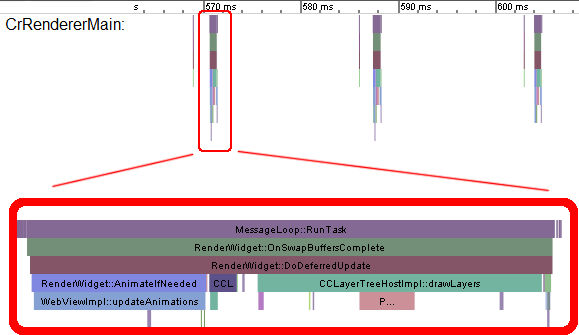
60FPS? That's for games and stuff, right?


Wrong. 60FPS applies to web pages as well!


  • Enable "show paint rectangles" to see painted areas
  • Check timeline to see time taken, memory usage, dimensions, and more...
  • Correlate to layout and script events - who triggered it?
  • Minimize the paint areas whenever possible

Measuring and fixing Jank


  • 60FPS affords you a 16.6ms budget per frame (1000 ms / 60 Hz = 16.6 ms)
  • It's better to be at consistent 30FPS then jump between variable frame-rates (aka, jank)
  • Jank demo: click here (open Timeline, hit record, and err.. enjoy)

Export / Import Timeline data


  • CMD-E to start & stop recording
  • Export & import JSON timeline data!
{"startTime": 1349100319000.9,
  "data": {
    "scriptName": "http://dnn506yrbagrg.cloudfront.net/pages/scripts/0011/6381.js?374750",
    "scriptLine": 1
  },
  "endTime": 1349100319001.1, "type": "FunctionCall", "usedHeapSize": 24341620,
  // ...

Finding and eliminating leaks

with the heap profiler

Heap snapshot + comparison view


  • Snapshot, save, import heap profile
  • Use comparison view to identify potential memory leaks (demo)
  • Use summary view to identify DOM leaks (demo)

Performance Audit


  • Built-in audits: network & web-performance
  • Great built-in CSS profiler
  • Extend it with your own scripts and logic!

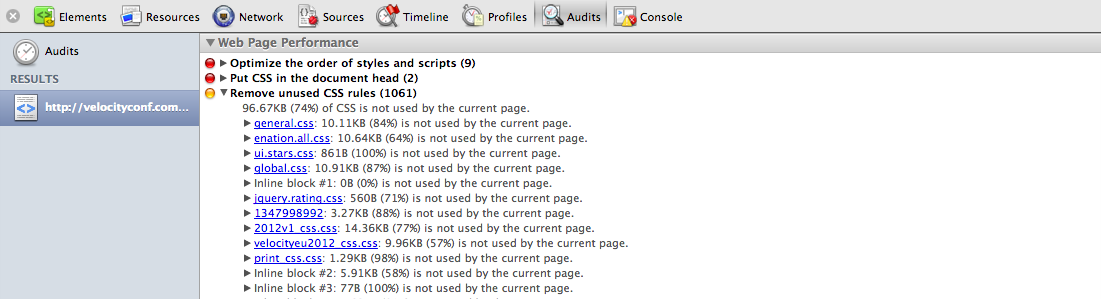
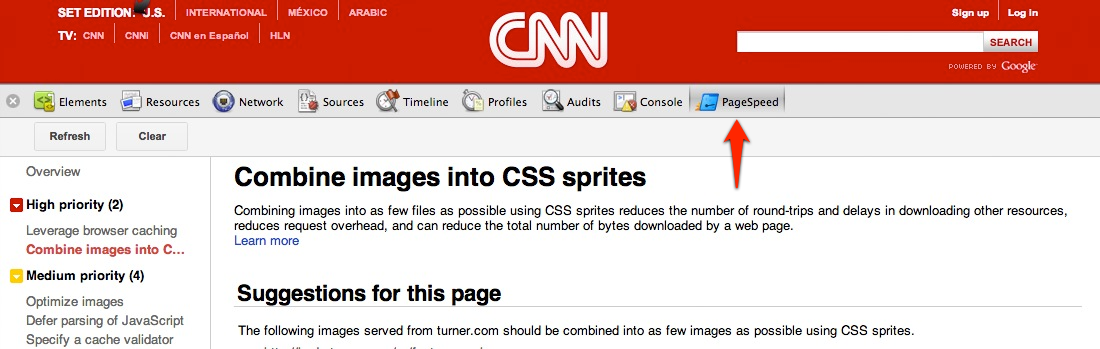
#protip: install PageSpeed Insights for up-to-date recommendations on performance best practices

PageSpeed Insights


  • Install PageSpeed Insights
  • Scans your current page, makes perfomance recommendations
  • Follow the "learn more" link to... learn more, about each recommendation!

A whirlwind tour of DevTools tips and tricks


  • Part I: DevTools tips, tricks and awesome features  (video)
  • Part II: Extending DevTools, Debug Protocol, Extensions, ... (video)

  • Follow along @ bit.ly/devtools-tips


Custom "readability" audit plugin


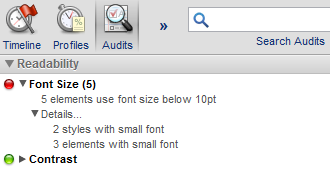
var category = chrome.experimental.devtools.audits.addCategory("Readability", 2);

category.onAuditStarted.addListener(function(results) {
  var details = results.createResult("Details...");
  var styles = details.addChild("2 styles with small font");
  var elements = details.addChild("3 elements with small font");

  results.addResult("Font Size (5)", "5 elements use font size below 10pt", results.Severity.Severe, details);
  results.addResult("Contrast", "Text should stand out from background", results.Severity.Info);
});

Example audit plugin. Are you doing repetitive tasks you can automate? Audit to the rescue!


Add a custom panel


chrome.devtools.panels.create("Font Picker", "FontPicker.png", "Panel.html", function(panel) { ... });
chrome.devtools.panels.elements.createSidebarPane("Font Properties",
    function(sidebar) {
      sidebar.setPage("Sidebar.html");
      sidebar.setHeight("8ex");
    });

Customize the look!


  • Mac OSX: ~/Library/Application Support/Google/Chrome/Default/User StyleSheets/Custom.css
  • Windows: C:/Users/AppDataLocal/Google/Chrome/User Data/Default/User StyleSheets/Custom.css
  • Ubuntu: ~/.config/chromium/Default/User StyleSheets/Custom.css

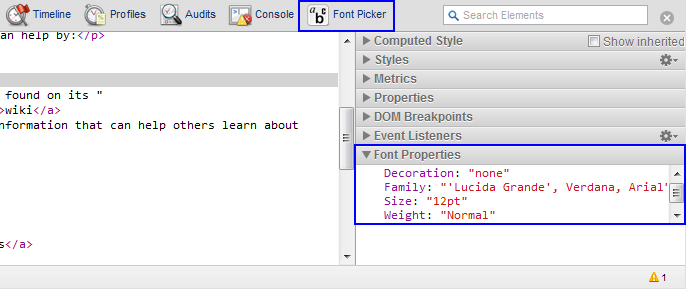
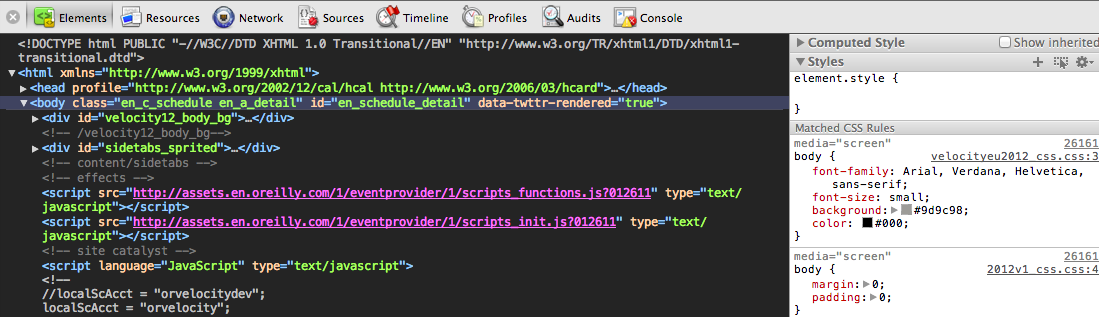
Make DevTools your own, customize the color scheme.

Remote debugging


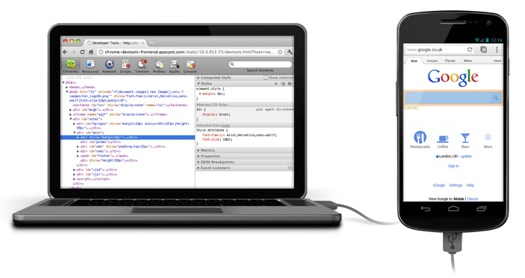
Connect your Android device via USB to the desktop & view and debug the code executing on the device. Or, connect to a remote Chrome instance!


$> adb forward tcp:9222 localabstract:chrome_devtools_remote
$> chrome.exe --remote-debugging-port=9222

DevTools is a web app!


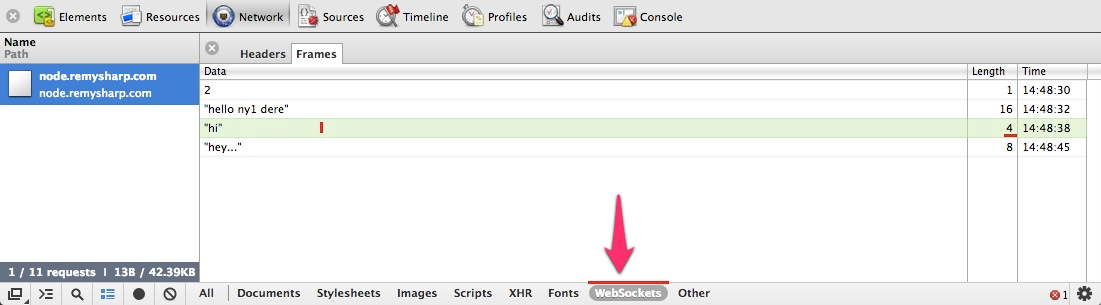
All data is generated and received via a WebSocket!


resp = http_get_json('http://localhost:9292/json')
ws = Faye::WebSocket::Client.new(resp.first['webSocketDebuggerUrl'])
ws.onopen = lambda do |event|
  ws.send JSON.dump({id: 1, method: 'Network.enable'})

  ws.send JSON.dump({
    id: 2,
    method: 'Page.navigate',
    params: {url: 'http://twitter.com/#!/search/chrome?q=devtools&' + rand(100).to_s}
  })
end

ws.onmessage = lambda do |event|
  p [:new_message, JSON.parse(event.data)]
end

Sample responseReceived event


You can consume this data in real-time...


"method":"Network.responseReceived",
"params":{
  "type":"XHR",
  "response":{
     "url":"http://api.twitter.com/1/trends/available.json?lang=en",
     "status":200,
     "statusText":"OK",
     "mimeType":"application/json",
     "connectionReused":false,
     "fromDiskCache":false,
     "timing":{
        "requestTime":1333830921.9814498,
        "connectStart":1,
        "receiveHeadersEnd":234
        // ...

Generate a custom debug feed

who said we're limited to Chrome?

Debugging iOS apps in DevTools!


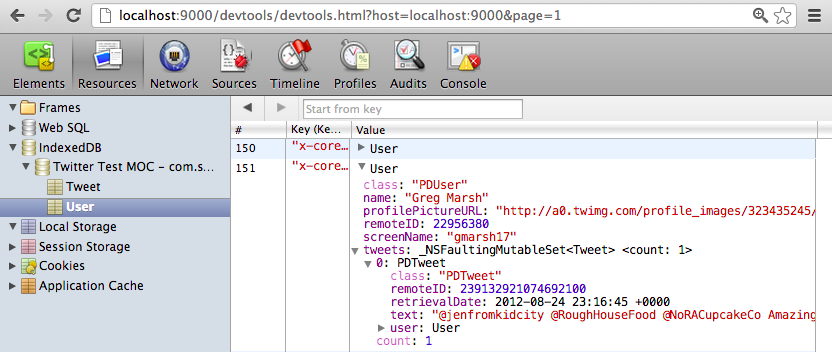
PonyDebugger is a client library and gateway server combination that uses Chrome Developer Tools on your browser to debug your application's network traffic and managed object contexts.


When you benchmark a page, do you...


  • clear the cache between each page load?
  • clear existing connections between each page load?
  • measures time-to-first-paint, PLT, others?
  • measure variance, std. dev, others?
  • test with both SPDY and HTTP?


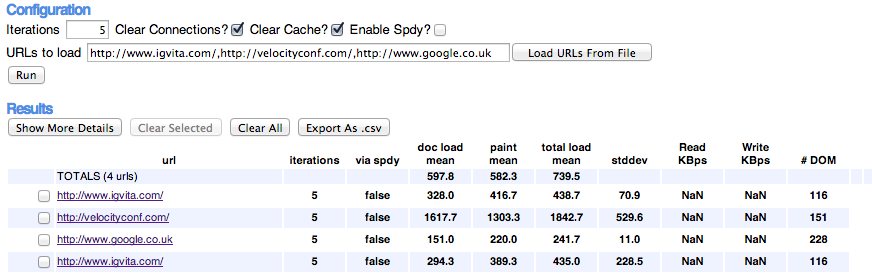
There are so many things to take into account...

Chrome Benchmarking to the rescue!


# Install extension @ https://chrome.google.com/webstore/detail/channimfdomahekjcahlbpccbgaopjll
$ path/to/chrome --enable-benchmarking
$ appify your-shell-script.sh "Your App Name" # OSX tip


Deep in the guts of the network stack...


  • chrome://predictors - omnibox predictor stats (check 'Filter zero confidences')
  • chrome://net-internals#sockets - current socket pool status
  • chrome://net-internals#dns - Chrome's in-memory DNS cache
  • chrome://histograms/DNS - histograms of your DNS performance
  • chrome://dns - startup prefetch list and subresource host cache

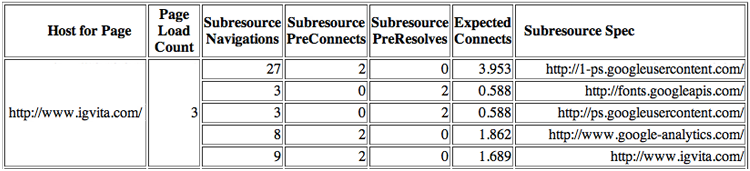
Ex, Chrome learns subresource domains:


Annotate tracing with own events


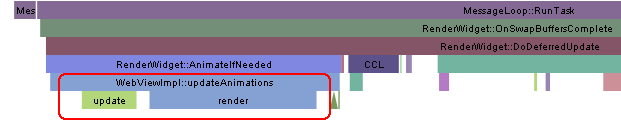
console.time("update");
update();
console.timeEnd("update");
console.time("render");
update();
console.timeEnd("render");

  • Where am I blocked? CPU? GPU?
  • chrome://tracing will help you find your bottleneck

Fin.


Slides @ bit.ly/devtools-tips