Distributed Logging: Syslog-ng & Splunk
If you haven't already, I encourage you to take Splunk for a test drive. While there is no shortage of distributed log aggregators on the market, few if any come with as much flexibility and firepower when it comes to indexing and search when you need to find a needle in a haystack of log data.
After deploying it for a collection of Ruby applications using a simple UDP logger, I've decided to push the ball even further and see if I could route the entire stack into Splunk: HAproxy, Nginx, Ruby, and others, all over the network. After a few false starts (and not wanting to go to an Enterprise license), I've stumbled on a surprisingly easy solution: syslog-ng!
Routing Syslog-ng directly to Splunk

Syslog-ng was designed from the ground up to be a distributed logging application. Unlike Splunk, it is not meant to be a log analysis package, which is perfect for us, since that is exactly what we're using Splunk for in the first place. Let's take a look at a simple config file:
# custom configuration for haproxy and Nginx
filter custom  { program("haproxy") or program("nginx"); };

log {
  # syslog
  source(s_sys);

  # filter everything but..
  filter(custom);

  # send to splunk, and local file
  destination(splunk);
  destination(local_log);
};

destination splunk { udp("192.168.0.198" port(9998)); };
destination local_log { file("/var/log/mylog.log"); };
syslog-ng.zip - Config files: syslog-ng, haproxy, nginx
The configuration syntax for syslog-ng is a pleasure to work with: consume all messages from the syslog, apply a custom filter which we've defined to accept HAProxy and Nginx, and send the messages to a remote Splunk server and a local log file!
Routing HAProxy and Nginx to Syslog-ng
With syslog-ng ready to go, we have to update HAProxy and Nginx to start logging to syslog. The former is easy and requires a one line change (see top of haproxy config file), but the latter (Nginx) requires applying a patch to the source (no worries, it's stable - confirmed and in production). All done? Let's open up Splunk and issue a request that gets routed through HAProxy and to our Nginx server:
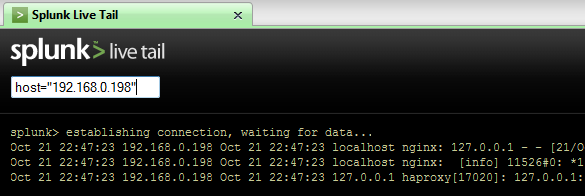
That's it, now you can see live logs from your Ruby, Haproxy, and Nginx processes stream live into your Splunk database for easy debugging and profiling. Of course, same procedures apply to any other process on a remote server - make it log to syslog, and you can route it to Splunk!
 Ilya Grigorik is a web ecosystem engineer, author of High Performance Browser Networking (O'Reilly), and Principal Engineer at Shopify — follow on Twitter.